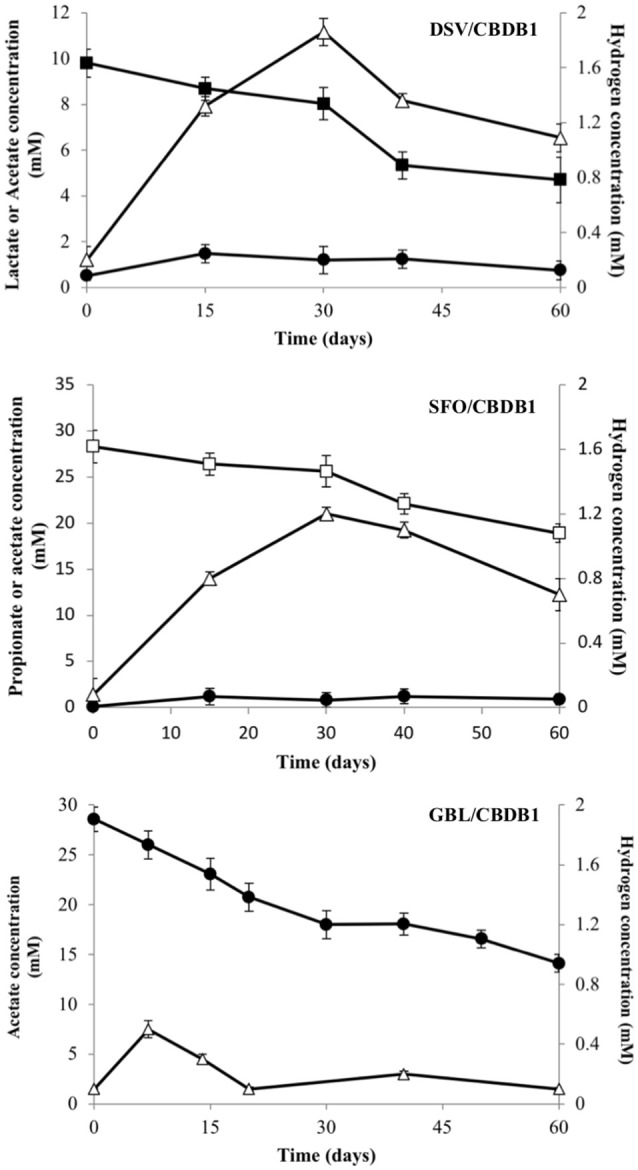
Figure 1.

Electron donor production and consumption in HCB reducing syntrophic co- cultmes DSV/CBDB1, SFO/CBDB1 and GBL/CBDB1. H2 (triangles), Acetate (circles), Lactate (closed squares), Propionate (open squares). Error bars represents standard deviation of the mean (n = 3).
