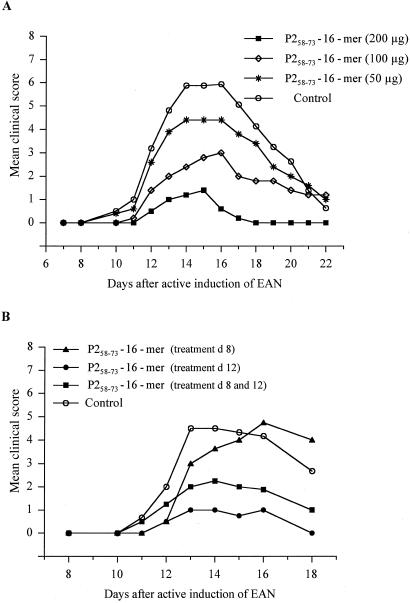
Figure 3.
Dose-dependence and timing of the induction of tolerance to active, P253–78 peptide-induced EAN by P2-16-mer. (A) Dose-response experiments. Animals were injected in the tail vein with the indicated amounts of P2-16-mer/1 ml PBS on days 8 and 12 after induction of active EAN. Control animals were injected i.v. with PBS. Values are given as mean clinical score in groups of five animals. P < 0.001 for 200 μg group vs. control group; P < 0.001 for 100 μg group vs. control group by ANOVA. (B) Timing experiments. Animals were injected in the tail vein with 200 μg of P2-16-mer/1 ml PBS at the indicated time points after induction of EAN. Control animals were injected i.v. with PBS. Values are given as mean clinical score in groups of four animals each. P < 0.05 for day 8 + 12 group vs. control group; P < 0.01 for day 12 vs. control group by ANOVA.

