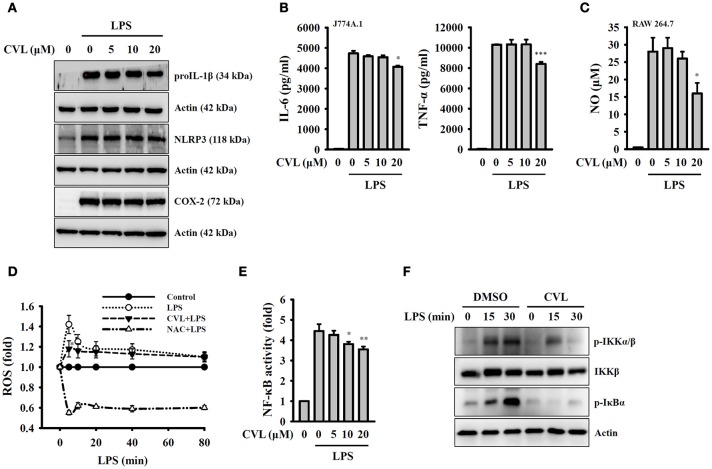
Figure 3.
CVL inhibited the NLRP3 inflammasome independent of the priming signal. (A,B) J774A.1 macrophages were incubated for 0.5 h with CVL followed by incubation for 6 h with LPS (1 μg/ml). The levels of NLRP3, proIL-1β, and COX-2 in the cell lysates were measured by Western blot (A), and the levels of IL-6 and TNF-α in the culture medium were measured by ELISA (B). (C) RAW 264.7 macrophages were incubated for 0.5 h with CVL followed by incubation for 24 h with LPS (1 μg/ml). The NO levels in the culture medium were measured by Griess reagent. (D) J774A.1 macrophages were incubated for 0.5 h with CVL (20 μM) or NAC (10 mM) followed by incubation for 0–80 min with LPS (1 μg/ml). The ROS levels in the cells were measured by 2′,7′-dichlorofluorescein diacetate. (E) J-Blue cells were incubated for 0.5 h with CVL or NAC (10 mM) followed by incubation for 24 h with LPS (1 μg/ml). The NF-κB activity was assayed using QUANTI-BlueTM alkaline phosphatase detection medium. (F) BMDM were incubated for 0.5 h with CVL or DMSO (vehicle) followed by incubation for 0–30 min with LPS (1 μg/ml). The phosphorylation levels of IKKα/β and IκBα in the cell lysates were measured by Western blot. The Western blot results are representative of three different experiments. The ELISA and NF-κB data are expressed as the mean ± SD of three separate experiments. *, ** and *** indicate a significant difference at the level of p < 0.05, p < 0.01 and p < 0.001, respectively, compared to LPS-treated cells.

