Figure 1.

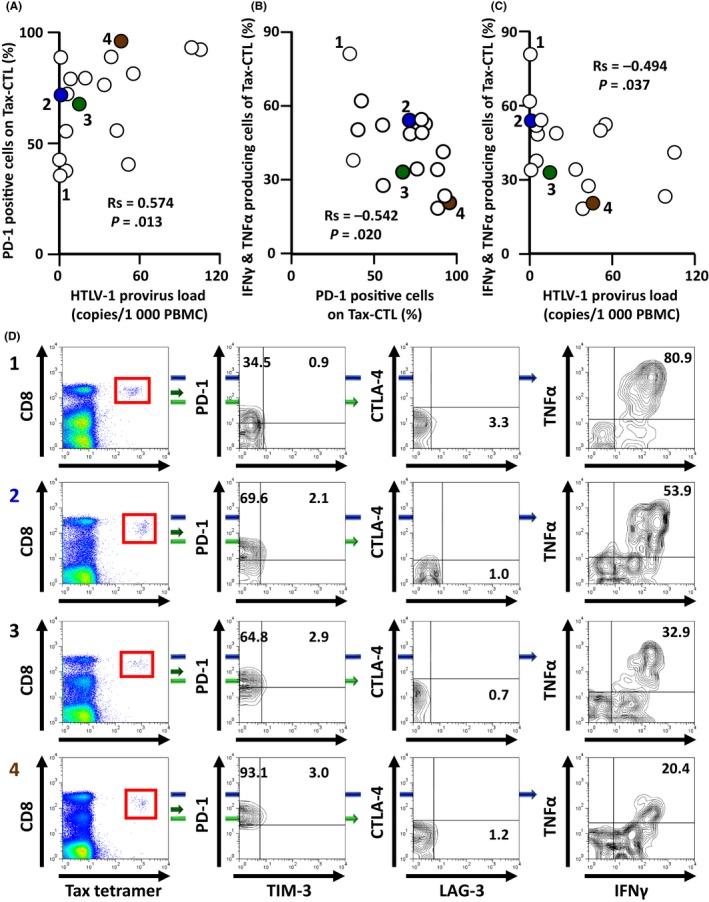
Relationships between programmed cell death protein 1 (PD‐1) positivity of Human T‐cell lymphotropic/leukemia virus type 1 (HTLV‐1) Tax‐specific cytotoxic T cells (Tax‐CTL) and the production of interferon (IFN)‐γ and tumor necrosis factor (TNF)‐α ex vivo in response to cognate peptide in HTLV‐1 asymptomatic carriers (AC). A, Correlation between HTLV‐1 provirus load in PBMC and the percentage of PD‐1‐positive Tax‐CTL in HTLV‐1 AC. There was a significant positive correlation between these two factors (Rs = 0.574, P = .013). B, Correlation between the percentage of PD‐1‐positive Tax‐CTL and the percentage of both IFN‐γ‐ and TNF‐α‐producing Tax‐CTL ex vivo in response to cognate peptide. There was a significant inverse correlation between these 2 factors (Rs = −0.542, P = .020). C, Correlation between the HTLV‐1 provirus load in PBMC and the percentage of both IFN‐γ‐ and TNF‐α‐producing Tax‐CTL ex vivo in response to cognate peptide. There was a significant inverse correlation between these 2 factors (Rs = −0.494, P = .037). D, Lymphocyte populations from HTLV‐1 AC donors 1, 2, 3, and 4 showing CD8 and HTLV‐1 Tax tetramer positivity. CD8 and HTLV‐1 Tax tetramer‐positive cells are gated as shown by the red squares (left panels), and plotted to show T‐cell immunoglobulin and mucin domain‐containing protein‐3 (TIM‐3) and PD‐1 positivity. Percentages of PD‐1‐positive but TIM‐3‐negative, and of PD‐1‐ and TIM‐3‐double‐positive cells are indicated in each panel (second left). CD8 and HTLV‐1 Tax tetramer‐positive cells are plotted to show lymphocyte‐activation gene 3 (LAG‐3) and cytotoxic T‐lymphocyte‐associated antigen 4 (CTLA‐4) positivity. Percentage of LAG‐3‐positive but CTLA‐4‐negative cells is indicated (second right). PBMC obtained from HTLV‐1 AC 1, 2, 3, and 4 were cocultured with or without cognate peptide (final concentration 100 nmol/L) at 37°C in 5% CO 2 for 3 h, after which brefeldin A was added. The cells were then incubated for an additional 2 h. Subsequently, IFN‐γ and TNF‐α production from Tax‐CTL was evaluated. Percentage of Tax‐CTL producing both IFN‐γ and TNF‐α in response to cognate peptide is indicated in each panel (right‐hand side). Plots labeled 1, 2, 3, and 4 in (A,B,C), correspond to 1, 2, 3, and 4, in (D), respectively. Plots labeled 2, 3, and 4 in (A,B,C) are colored blue, green, and brown, respectively
