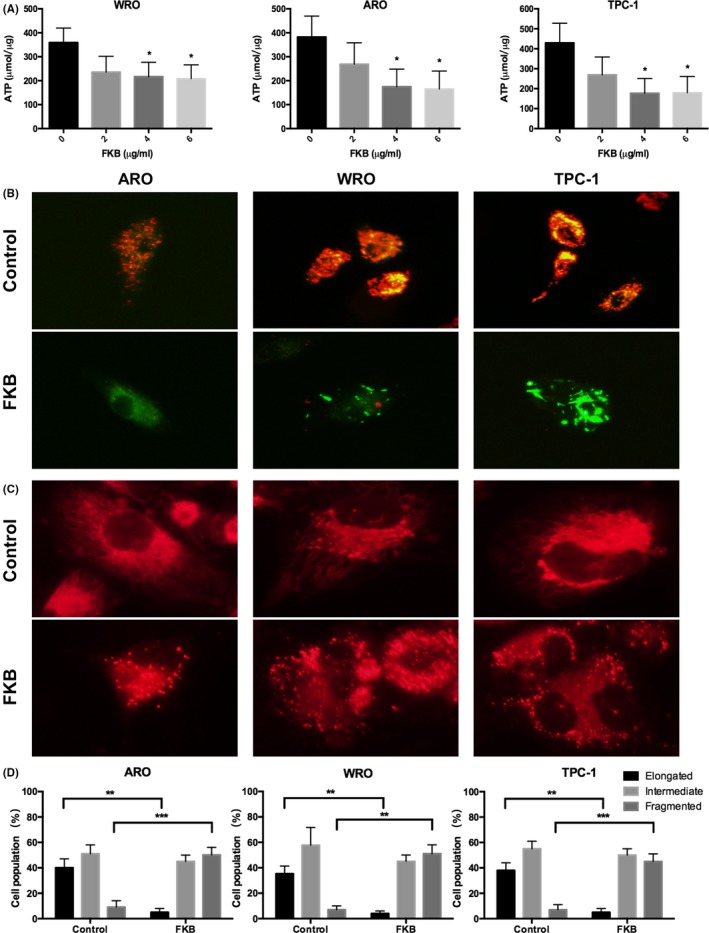
Figure 3.

Flavokawain (FKB) induces mitochondrial dysfunction in thyroid cancer cells. (A) ATP synthesis levels in ARO, WRO, and TPC‐1 cells treated with different concentrations of FKB for 24 h. (B) Representative images of ARO, WRO, and TPC‐1 cells incubated with the JC‐1 probe to determine mitochondrial membrane potential and treated with 6 μg/mL FKB for 24 h. Images were acquired under different wavelengths and superimposed. (C) MitoTracker Red staining for mitochondria in ARO, WRO, and TPC‐1 cells treated with 6 μg/mL FKB or DMSO for 24 h. (D) Statistical results of the mitochondrial network in ARO, WRO, and TPC‐1 cells treated with 6 μg/mL FKB or DMSO for 24 h. All data are expressed as the mean ± SD. *P < 0.05; **P < 0.01; ***P < 0.001
