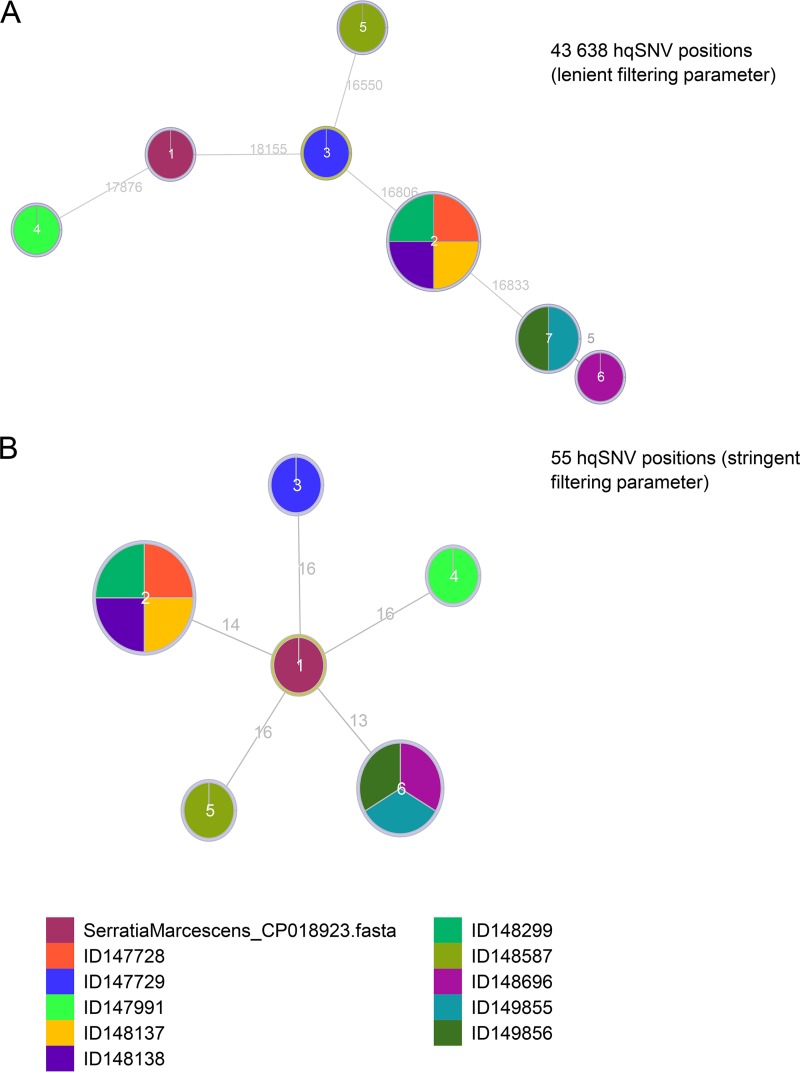
FIG 2.
Graphic representation of the minimum spanning trees resulting from WGS typing of the 10 isolates recovered during the outbreak investigation, using core genome hqSNV analysis with density cutoff values of 2 SNVs/20 bp (A) or 2 SNVs/500 bp (B). The numbers on the branches denote the numbers of hqSNV differences. Isolates ID149855 and ID149856 are from the same patient.

