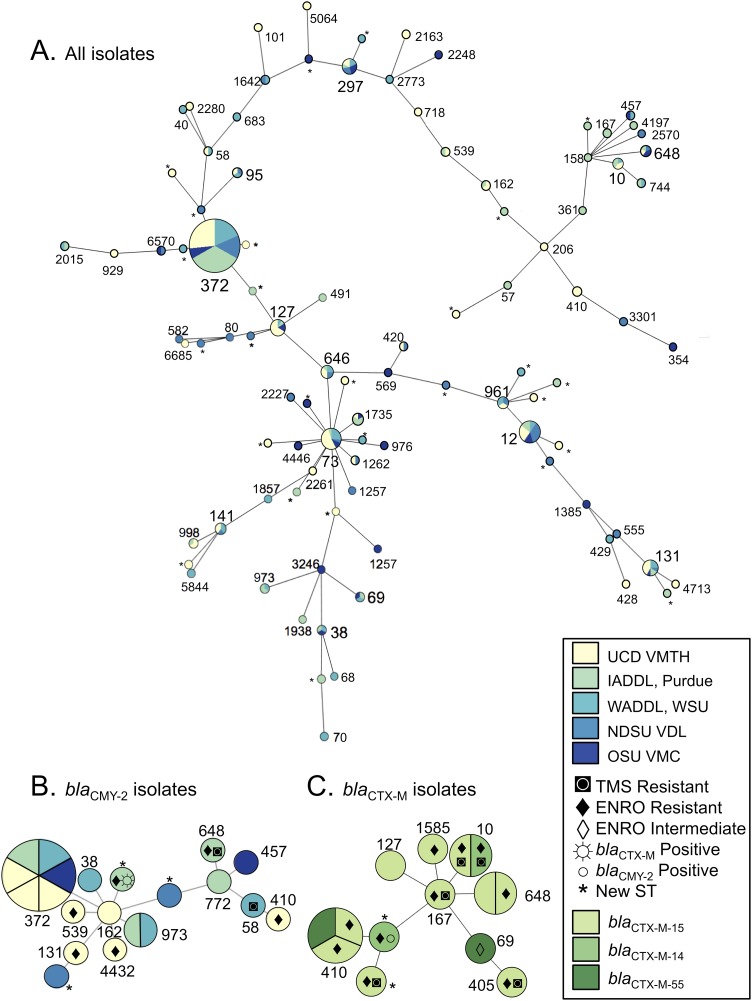
FIG 2.
Phylogenetic relatedness of the isolates in the study inferred by goeBURST. The size of each node is scaled to the number of isolates of that ST, and the distance between the nodes is scaled to the number of allele differences between STs. Nodes are labeled with ST number. (A) Phylogenetic relatedness of all isolates in the study. The color represents the laboratory source of the isolate. (B) blaCMY-2 isolates in the study and the coresistances are shown for each blaCMY-2 isolate. The color represents the laboratory source of the isolate. (C) blaCTX-M isolates in the study and the coresistances are shown for each isolate. The color represents the blaCTX-M gene in each isolate.

