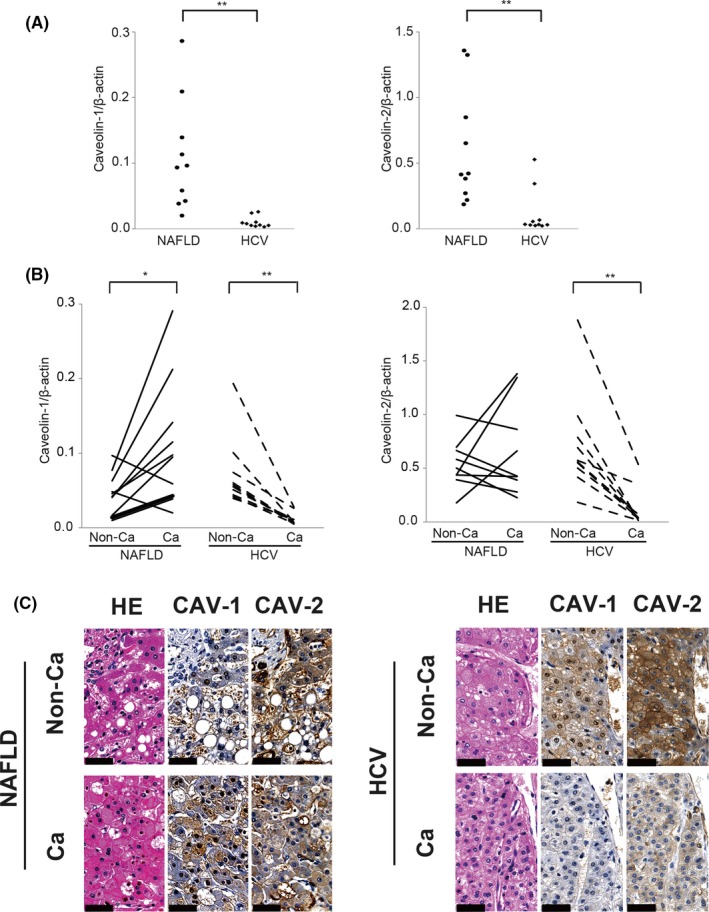
Figure 2.

Quantitative RT‐PCR and immunohistochemical analysis of caveolin (CAV) expression in resected hepatocellular carcinoma (HCC) specimens. (A) Quantitative RT‐PCR analysis of CAV‐1 (left panel) and CAV‐2 (right panel) in HCC derived from non‐alcoholic fatty liver disease (NAFLD) and hepatitis C virus (HCV) infection. **P < 0.01, Mann–Whitney U‐test. (B) Comparison of CAV‐1 (left panel) and CAV‐2 (right panel) expression between non‐cancer (Non‐Ca) tissue and cancer tissue (Ca). *P < 0.05, **P < 0.01, Student's t‐test and Mann–Whitney U‐test. (C) In the immunohistochemical analysis, Non‐Ca and Ca lesions derived from NAFLD‐HCC or HCV‐HCC were stained with H&E or antibodies against CAV‐1 or CAV‐2. Caveolin immunoreactivity is visible as a brown color in the membrane or cytosol; nuclei are visible as a blue color by hematoxylin staining. Results are expressed as the mean ± SD. Scale bar = 50 μm
