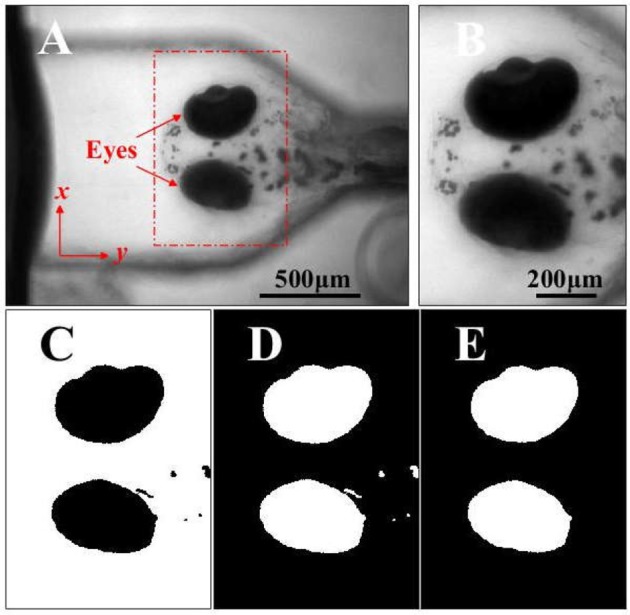
Figure 2.

(A) The head and eyes (red arrows) of a zebrafish larva acquired in a video series by the VOR test system. (B) The ROI containing the eyes is selected and used to analyze the eye movements and VOR. (C) The binary image of image in B (black eyes). (D) The inversed binary image of image in C (white eyes). (E) The inversed binary image in D, where the small flecks are removed by applying the area threshold, and the image is subsequently used to analyze the movements of the eyes stimulated by the rotation. Scale bars: in (A) 500 μm for A; in B, 200 μm for (B–E).
