Figure 3.
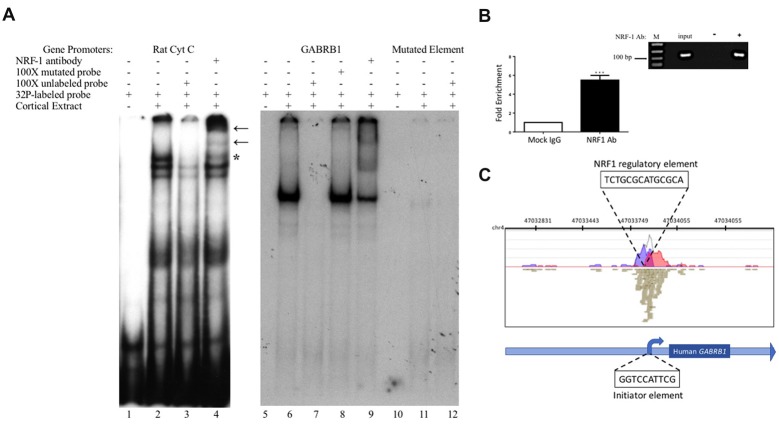
In vitro and in vivo binding of NRF-1 to the putative NRF-1 site in GABRB1. (A) 32P-labeled probes encompassing the NRF-1 binding site were incubated with 20 μg of DIV7 primary rat cortical nuclear extracts. 100-fold excess of unlabeled probe was added to the binding reaction to assess specificity. NRF-1 Abs were pre-incubated with nuclear extracts and radiolabeled probe to test for “supershift” and protein identification. (Left Panel) The NRF-1 element in the rat cytochrome c (Cyt C) promoter displays NRF-1 specific binding (lane 2) and “supershift” (lane 4). (Right Panel) The proposed NRF-1 element in the human GABRB1 promoter displays a probe specific shift (lane 6; note that excess probe was run off of the gel to provide room for the detection of the shifted probe), competition of complex formation with cold competitor (lane 7), lack of competition with mutant cold competitor (lane 8), and supershift upon addition of NRF-1 specific Ab (lane 9). In contrast, binding to radiolabeled probe for NRF-1 mutant GABRB1 shows markedly reduced signal strength (lanes 11 and 12). “*” Indicates specific interaction between labeled probe and nuclear extract, “←” indicates location of supershift. (B) Chromatin Immunoprecipitation (ChIP) assays were performed using sonicated genomic DNA from DIV7 primary rat cortical neurons and either ChIP grade NRF-1 polyclonal antibody (Abcam, ab34682) that recognizes the full length protein or rabbit IgG (Vector Laboratories, I-1,000). Co-precipitated GABRB1 gene promoter fragments were detected with specific quantitative PCR (qPCR) primers and probe. Data represent the average ± SEM of n = 4 independent primary cultures and co-precipitations. ***p < 0.001, student t-test. (C) Representative ChIP-seq track from the Strand NGS software platform for GABRB1 in H1-hESC cells after peak detection (MACS version 2.0). Read density profile plots of forward reads (blue) and reverse reads (red) aligned to the UCSC transcript model are depicted; each brown box represents a single 27-bp sequencing read. The NRF-1 motif sequence is shown in black text above its position. Relative position of the Inr in GABRB1 is shown for reference. Chr, chromosome. (A,B) Datasets were originally published in the thesis of Li (2015).

