FIG 6.
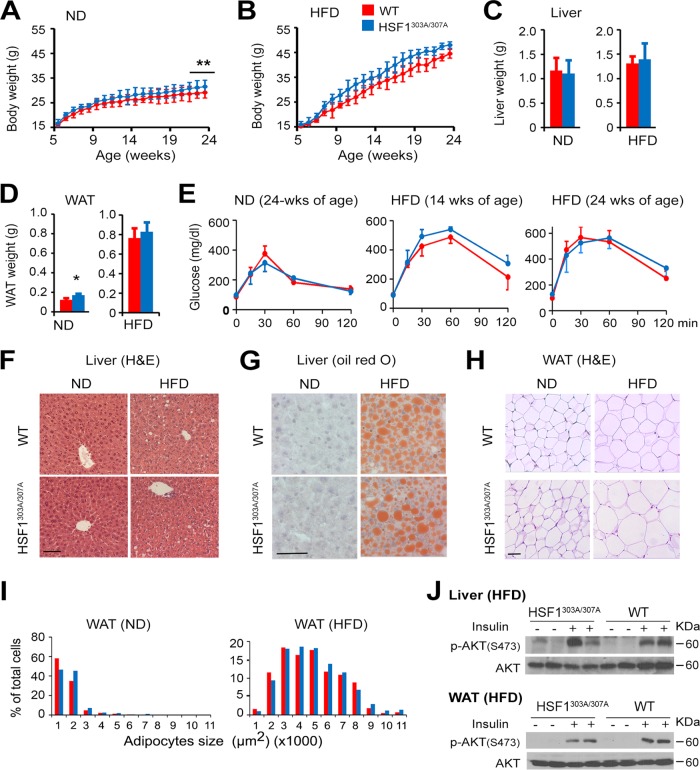
Mutation of S303/S307 does not have measurable effects on HFD-induced obesity and insulin resistance. (A and B) Body weight gain in WT and HSF1303A/307A male mice maintained on standard normal diet (ND) or on a high-fat-diet (HFD) beginning at 4 weeks of age and for a period of 20 weeks. Scale bars are means ± SD (n = 10 mice per group for ND; n = 13 mice per group for HFD). **, P < 0.01. (C and D) Weights of liver and adipose tissue (WAT) of 24-week-old WT and HSF1303A/307A mice maintained on ND or HFD as described for panels A and B. Bars are means ± SD. *, P < 0.05. (E) Glucose tolerance test (GTT) on WT and HSF11303A/307A mice maintained on ND (24 weeks of age) or HFD for 10 or 20 weeks beginning at 4 weeks of age. Bars are means ± SD (n = 5 mice per genotype). (F and G) Representative liver sections from 24-week-old WT and HSF1303A/307A mice on ND or HFD as indicated in panels A and B. Sections were stained with H&E (F) or oil red O (G). Bars, 50 μm. (H) Representative WAT tissue sections from 24-week-old WT and HSF1303A/307A mice as indicated for panels A and B, stained with H&E. (I) Quantification of the data from sections in panel H. Whisker plot of adipocyte sizes from evaluation of 300 adipocytes in 10 randomly selected microscopic fields expressed as percentage of the total analyzed cells (bar, 50 μm). Bars are means ± SD (n = 4 mice per genotype). (J) Immunoblot analysis of insulin-induced AKT signaling in liver and WAT of 24-week-old WT and HSF1303A/307A mice fed with HFD for 20 weeks. Mice were fasted for 16 h and injected with saline or insulin (2 mU/g) i.p. Insulin-induced signaling in tissue extracts was examined 10 min after insulin or saline injection. The level of p-AKT (Ser473) was examined. Bars are means ± SD (n = 4 mice per genotype). For all panels, red represents WT (red) and blue represents HSF1303A/307A mice.

