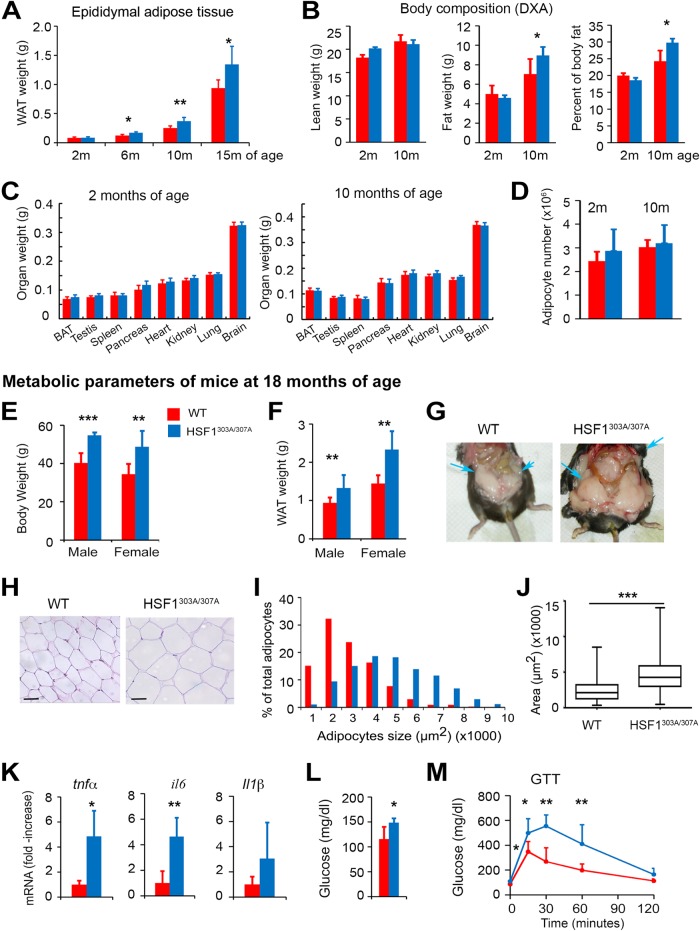
FIG 9.
HSF1303A/307A mice are profoundly susceptible to advanced age-dependent metabolic decline associated with development of obesity and insulin resistance. (A to C) Epididymal WAT weight (A), total body fat distribution measured by DXA (B), and weight of indicating organs (C) of mutant HSF1 and WT control mice of different ages maintained on ND (n = 4 to 10 mice per group). BAT, brown adipose tissue. (D) Evaluation of hyperplasia in epididymal WAT by extrapolating the total number of adipocytes from the size of adipocytes (via histology) and the weight of the fat depots in wild-type and mutant mice. Analyses were performed on mice maintained on ND, at an early (2 months) and advanced (10 months) age (n = 4 mice per group). (E and F) Body weight and epididymal WAT mass of 18-month-old WT and HSF1303A/307A mice fed an ND. Bars are means ± SD (n = 11 male and n = 10 female WT mice per group; n = 8 male and n = 13 female mutant mice per group). (G) Representative abdominal depots (arrows) of 18-month-old WT and HSF1303A/307A mice exhibiting a substantial increase in the amount of fat tissue in a mutant mouse. (H) Histological analysis (H&E staining) of epididymal WAT sections of 18-month-old WT and HSF1303A/307A mice on ND. The analysis revealed that HSF1303A/307A adipocytes were consistently larger than adipocytes from age-matched WT mice. Bars, 50 μm. (I and J) Data from whisker plots of adipocyte sizes from evaluation of 300 adipocytes in 10 randomly selected microscopic fields expressed as percentages of the total analyzed cells (I); averages of adipocyte areas (J); (n = 5 mice per genotype). (K) Increased expression of inflammatory cytokines in WAT of HSF1303A/307A aged mice. mRNA transcript levels of selected cytokine genes (tnfα, il6, and il1β) in WAT of 18-month-old WT and HSF1303A/307A mice measured by quantitative RT-PCR. Values are presented as relative mRNA expression (n = 5 mice per genotype). (L and M) Blood glucose levels and GTT in 16-h-fasted 18-month-old WT and HSF1303A/307A mice (n = 5 mice per genotype). For all panels, error bars are means ± SD. *, P < 0.05; **, P < 0.01; ***, P < 0.001. Red, WT mice; blue, HSF1303A/307A mice.

