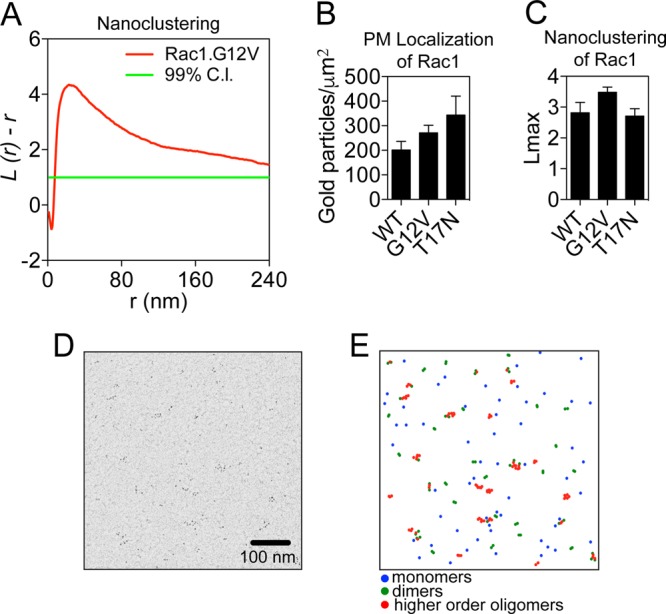
FIG 1.

Rac1 forms nanoclusters on the plasma membrane. (A) Clustering quantification. A plot of the weighted mean standardized univariate K function for GFP-Rac1.G12V is shown. 99% CI, 99% confidence interval for a random pattern. Values for L(r) − r above the confidence interval indicate significant clustering. (B) Intact PM sheets from BHK cells ectopically expressing GFP-Rac1.WT, GFP-Rac1.G12V, or GFP-Rac1.T17N were labeled with anti-GFP coupled to 4.5-nm gold particles and visualized by EM. The number of gold particles per square micrometer quantifies the extent of PM localization and is shown as means ± standard errors of the means (n = 15 to 20 PM sheets). (C) The same PM sheets as described for panel B were analyzed using univariate K functions, and the resulting data were summarized as mean Lmax ± standard error of the mean. (D) Sample EM image (1 μm2) of 4.5-nm gold particles on a PM sheet taken from BHK cells expressing GFP-Rac1.G12V. (E) Local L(r) mapping (with r = 15 nm) was applied to the image in panel D to identify monomers, dimers, and higher-order oligomers, which were then color-coded as per the legend.
