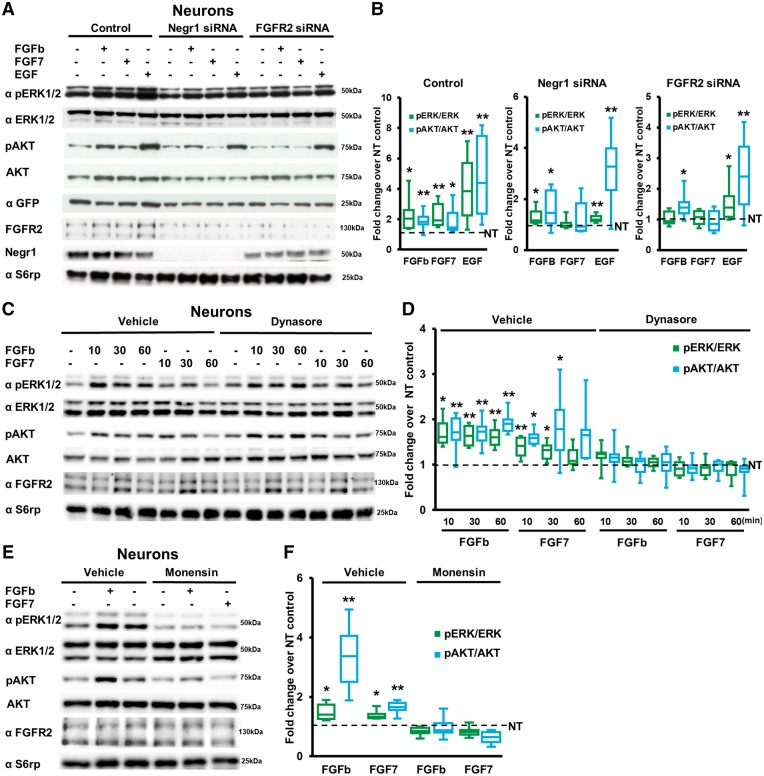
Figure 4.
NEGR1 influences FGFR2 signalling. (A) Representative immunoblots on protein extracts from lysates of DIV14 cortical neurons infected at DIV4 with viruses bearing plasmids expressing GFP together with control siRNA (Control), Negr1 siRNA or Fgfr2 siRNA and treated at DIV 14 with vehicle, FGFb, FGF7 or EGF. Equal level of infection was monitored by GFP expression, whereas total protein amount was monitored by S6rp staining. (B) Quantification of the ratio between pERK and total ERK, or pAKT and total AKT protein expression. Data are expressed as average percentage of pERK/ERK or pAKT/AKT ratio in drug-treated neurons normalized to vehicle-treated neurons (NT, dotted line). Asterisks indicate statistically significant difference versus vehicle-treated neurons (one sample t-test versus hypothetical value 1: *P < 0.05, **P < 0.01, n = 8 independent experiments). (C) Representative immunoblots on protein extracts from lysates of DIV14 cortical neurons treated with vehicle or dynasore to prevent receptor internalization and then stimulated with FGFb or FGF7 for the time indicated. (D) Quantification of the ratio between pERK and total ERK or pAKT and total AKT protein expression in experiments as in C. Data are expressed as average percentage of pERK/ERK or pAKT/AKT ratio in drug-treated neurons normalized to control vehicle-treated neurons (NT, dotted line); Asterisks indicate statistically significant difference versus vehicle-treated neurons (one sample t-test versus hypothetical value 1: *P < 0.05, **P < 0.01, n = 8 independent experiments). (E) Representative immunoblots on protein extracts from lysates of DIV14 cortical neurons treated with vehicle or monensin to prevent receptor recycling and then stimulated with FGFb or FGF7 for 10 min. (F) Quantification of the ratio between pERK and total ERK or pAKT and total AKT protein expression. Data are expressed as average percentage of pERK/ERK or pAKT/AKT ratio in drug-treated neurons normalized to vehicle treated (NT, dotted line). Asterisks indicate statistically significant difference versus vehicle treated (one sample t-test versus hypothetical value 1: *P < 0.05, **P < 0.01, n = 8 independent experiments).

