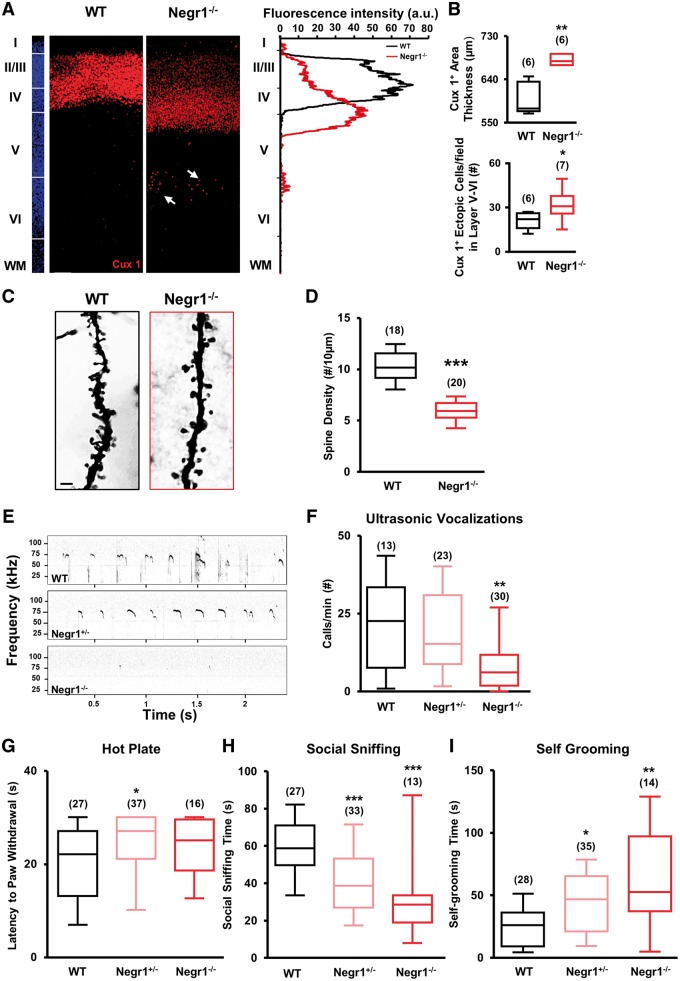
Figure 6.
Negr1–/– animals display abnormalities in cortical upper layering and core behaviours related to ASD. (A) Left: Confocal images of Cux1 immunostaining (red) in the somatosensory cortex of wild-type and Negr1−/− littermates at P7. Arrows: ectopic cells. Slices were counterstained with DAPI (blue). Scale bar = 50 µm. Right: Quantification of the fluorescence intensity of Cux1 staining in the images from left, showing a shift towards layer IV in the Negr1−/− animal in comparison with wild-type. (B) Top: Quantification of the thickness of layers II–IV based on the distribution of Cux1-positive cells in wild-type and Negr1−/− animals. Data are expressed as average thickness of Cux1-stained area. Asterisks indicate statistically significant difference versus wild-type (Mann Whitney test: **P < 0.01). Bottom: Quantification of the number of Cux1-positive cells ectopically located outside layers II–IV in wild-type and Negr1−/− animals. Data are expressed as number of Cux1-positive cells in layer V–VI. Asterisks indicate statistically significant difference versus wild-type (unpaired Student’s t-test: *P < 0.05). Numbers in parenthesis indicate total number of processed animals (1 slice/animal). (C) Light-transmitted image of Golgi-Cox stained slices of the somatosensory cortex of wild-type and Negr1−/− littermates at P7. Scale bar = 2 µm. (D) Quantification of spine density in experiments as in C. Data are expressed as average of spine density. Asterisks indicate statistically significant difference (Student’s t-test: ***P < 0.001). Numbers in parenthesis indicate total number of processed cells from two different animals per genotype (3 slices/animal). (E) Example of a fraction of the recordings of ultrasonic vocalizations emitted by P4 pups upon isolation from their dam and littermates. (F) Quantification of the number of ultrasonic vocalizations during the entire isolation in experiments as in C. Data are expressed as the average of the total number of emitted calls/min. Asterisks indicate statistically significant difference versus wild-type (one-way ANOVA against wild-type, post hoc Holm-Sidak: **P < 0.01). (G) Latency to paw withdrawal of P9 pups after placement on a hot plate. Asterisks indicate statistically significant difference versus wild-type (one-way ANOVA against wild-type; post hoc Holm-Sidak: *P < 0.05). (H) Quantification of the time spent performing social sniffing by P20–25 animals during juvenile play with a stranger peer from a different litter. Asterisks indicate statistically significant difference versus wild-type (one-way ANOVA against wild-type; post hoc Holm-Sidak: ***P < 0.001). (I) Quantification of the average total time spent by P20–25 animals on self-grooming behaviour, during 10 min of juvenile play with a stranger mouse from a different litter. Asterisks indicate statistically significant difference versus wild-type (Kruskal-Wallis test against wild-type; post hoc Dunn’s: *P < 0.05, **P < 0.01). For all behavioural data, numbers in parenthesis indicate total number of analysed animals, 4–11 litters per experimental case.

