Figure 6.
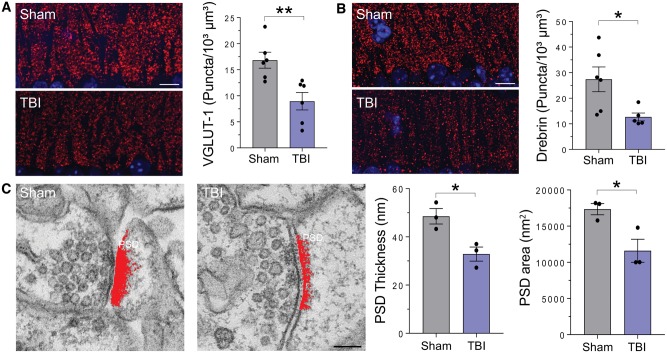
Synaptic alterations in the hippocampus of TBI inoculated mice. (A and B) Representative images of immunofluorescence staining and quantitative analysis of presynaptic (VGLUT-1; A) and postsynaptic (drebrin; B) markers in the hippocampus of the inoculated mice at 12 months post-inoculation. Data are mean ± SEM; n = 5–6; *P < 0.05; **P < 0.01 by unpaired t-test. Scale bar = 10 µm. (C) Representative electron micrographs of stratum oriens synapses, and quantification of the thickness and area of the postsynaptic density in sham and TBI inoculated mice. Data are mean ± SEM; n = 3. *P < 0.05 by unpaired t-test. Scale bar = 100 nm.

