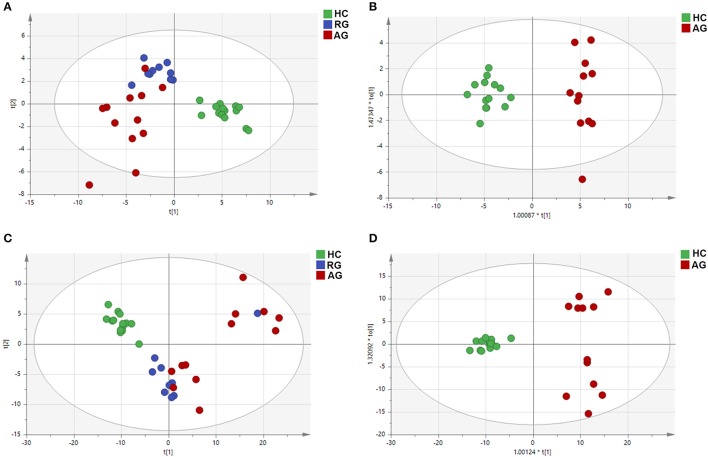
Figure 2.
PCA and OPLS-DA of the metabolic profiles of serum samples in HC, RG, and AG groups of Discovery phase analyzed by C18 and HILIC column chromatography. (A), PCA analysis in C18 mode; (B), OPLS-DA analysis in C18 mode; (C), PCA analysis in HILIC mode; (D), OPLS-DA analysis in HILIC mode. Red nodes, blue nodes and green nodes respectively represented the samples of the subjects in AG, RG, and HC groups. PCA: principal components analysis; OPLS-DA: orthogonal partial least-squares-discriminant analysis; HILIC: hydrophilic interaction liquid chromatography. The HC, RG, and AG groups in Discovery phase included 14, 10, 12 subjects, respectively.

