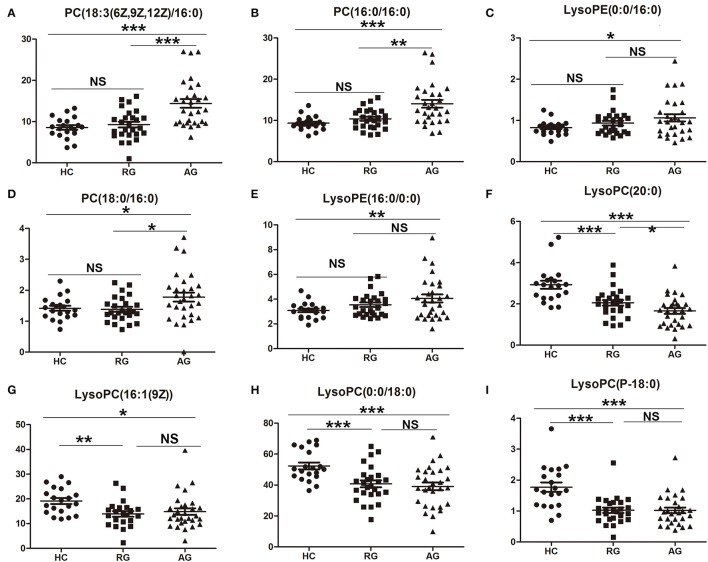
Figure 5.
Validation of the abundance of SCMs generated from C18 column chromatography in AG, RG, and HC groups in Validation phase. (A), PC(18:3(6Z,9Z,12Z)/16:0); (B), PC(16:0/16:0); (C), LysoPE(0:0/16:0); (D), PC(18:0/16:0); (E), LysoPE(16:0/0:0); (F), LysoPC(20:0)); (G), LysoPC(16:1(9Z)); (H), LysoPC(0:0/18:0); (I), LysoPC(P-18:0). *indicates P < 0.05, **indicates P < 0.01, and ***indicates P < 0.001. P < 0.05 indicates statistical significance. SCMs, significantly changed metabolites. Targeted metabolomics analyses was used to validate the abundance of SCMs in Validation phsge. The HC, RG, and AG groups in Validation phase included 20, 26, 29 subjects, respectively.

