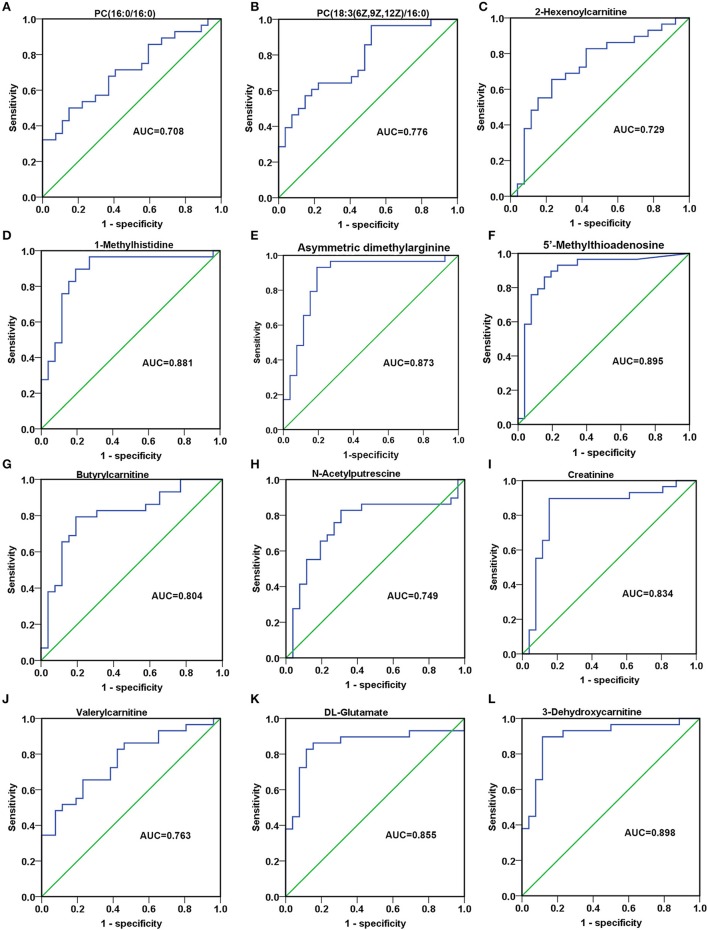
Figure 8.
The discriminatory ability of SCMs between AG patients and RG patients was analyzed using an ROC curve in Validation phase. (A), PC(16:0/16:0); (B), PC(18:3(6Z,9Z,12Z)/16:0); (C), 2-Hexenoylcarnitine; (D), 1-Methylhistidine; (E), Asymmetric dimethylarginine; (F), 5′-Methylthioadenosine; (G), Butyrylcarnitine; (H), N-Acetylputrescine; (I), Creatinine; (J), Valerylcarnitine; (K), DL-Glutamate; (L), 3-Dehydroxycarnitine. ROC, receiver operating characteristic curve. ROC curves and AUC were obtained by SPSS22.0 software. The HC, RG, and AG groups in Validation phase included 20, 26, 29 subjects, respectively.

