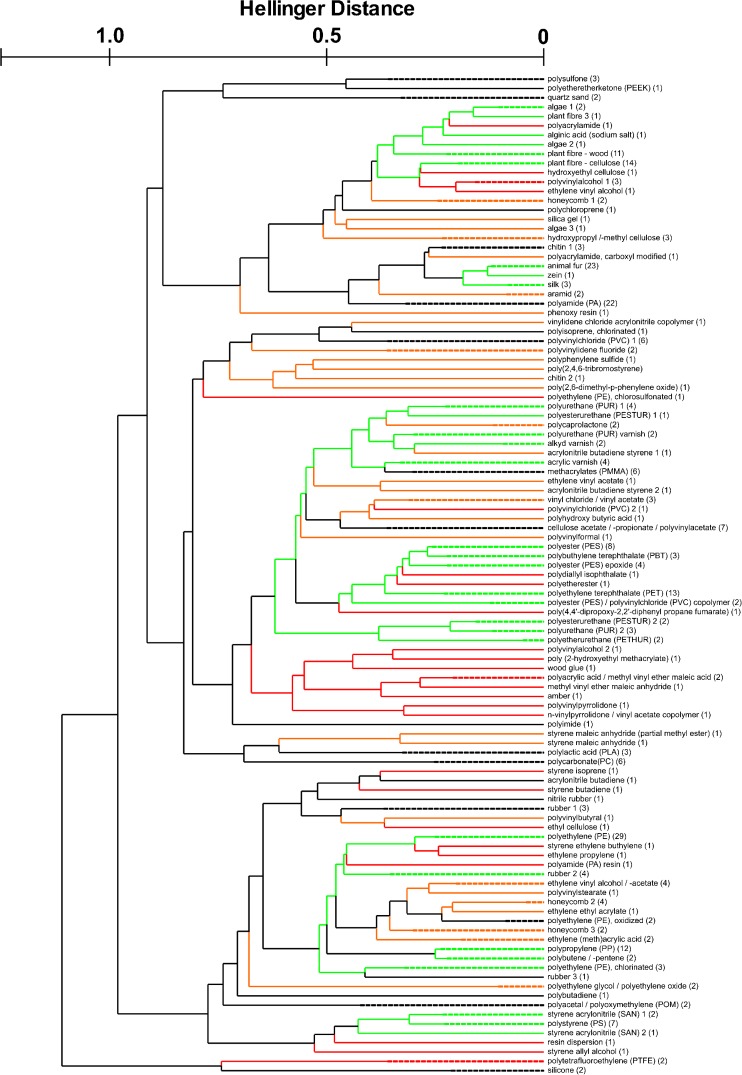
Fig. 1.
Dendrogram of manually generated clusters. For lucidity, the spectra were grouped and the number of contained spectra written in brackets behind the cluster name. All merged clusters (see text for details) were connected by green lines; for all later excluded clusters, the lines are marked red (reduction of clusters) and orange (cluster categories)

