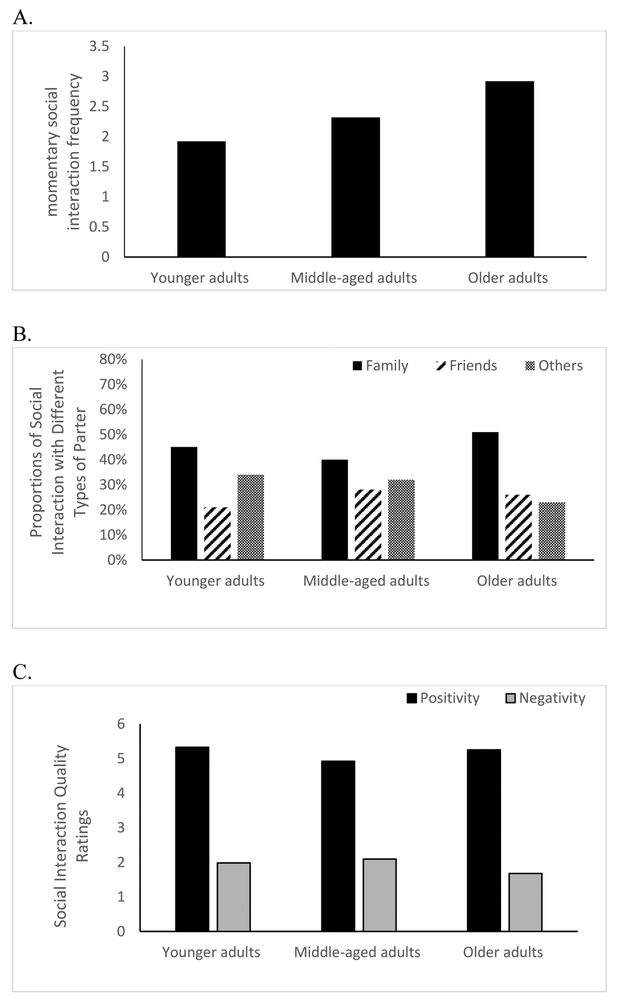
Figure 1.
Description of social interaction characteristics across different age groups. (A) Interaction frequency. (B) Interaction partner types. (C) Interaction quality. N=173 for the whole sample. N = 56 for young adults (20 to 39 years old); N = 61 for middle-age adults (40 to 59 years old); N = 56 for older adults (60 to 79 years old).

