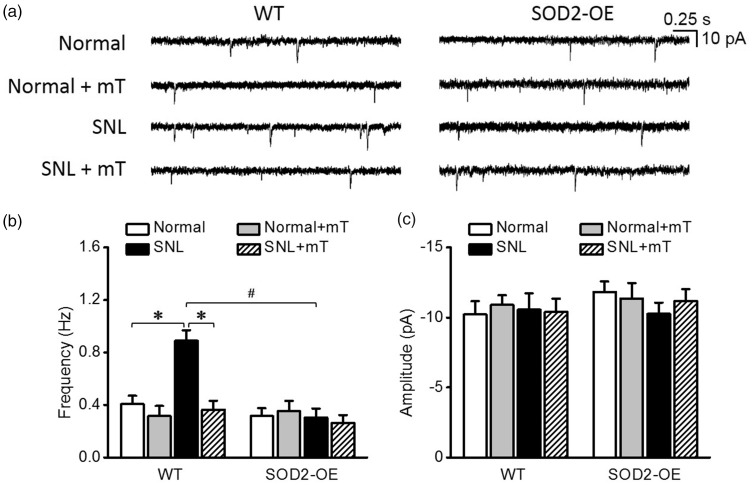
Figure 3.
Miniature excitatory postsynaptic currents (mEPSCs) in spinal dorsal horn neurons of normal and neuropathic SOD2-OE mice and their WT littermates. (a) Representative traces of mEPSCs in each group. The summary graphs of the mean frequency (b) and amplitude (c) of mEPSCs in each group. Unlike their WT littermates that showed an increase in mEPSC frequency after SNL, SOD2-OE mice did not show such an increase after SNL. The increased mEPSC frequency in WT group was reduced by mT. Amplitudes of mEPSC were not different between groups. *p < 0.05 between normal vs. SNL and between SNL vs. SNL+mT; #p < 0.05 between SNL WT mice vs. SNL SOD2-OE mice by two-way analysis of variance followed by Holm–Sidak multiple comparison tests. WT: wild-type; SNL: spinal nerve ligation.

