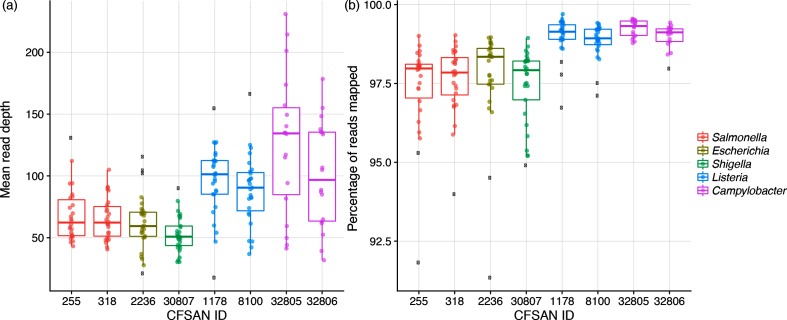
Fig. 2.
Box and whisker plots summarizing two different coverage statistics: (a) mean read depth and (b) percentage of reads mapped to the reference. The box defines the median value, as well as the lower and upper quartiles (25 and 75 %). The whiskers extend to the most extreme data point that is no more than 2.5 times the interquartile range from the median. Outliers are shown as black dots. The colours are genus specific.

