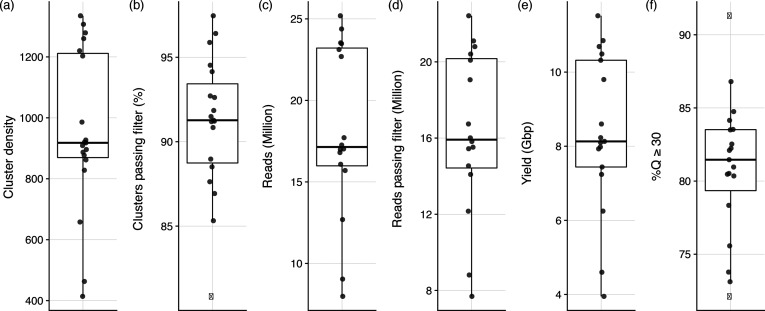
Fig. 4.
Box and whisker plots summarizing six different MiSeq run metrics reported by the participating laboratories: (a) cluster density, (b) clusters passing filter, (c) number of reads collected, (d) per cent of reads passing filter, (e) total data yield in Gbp, and (f) percentage of Q scores greater or equal to Q30. The box defines the median value, as well as the lower and upper quartiles (25 and 75 %). The whiskers extend to the most extreme data point that is no more than 2.5 times the interquartile range from the median. Outliers are shown as black dots. Abbreviations for isolate metrics: Reads_M, number of sequencing reads passing filter for a given isolate; SeqLength, range of sequencing read lengths; MeanR1, Q score representing the mean of the mean read quality of R1 (forward) reads; MeanR2, Q score representing the mean of the mean read quality of R2 (reverse) reads; PercMapped, percentage of reads that could be mapped to the reference genome; MeanDepth, mean depth (coverage) of reads mapped to the reference genome; SNPs, SNPs reported by the CFSAN SNP Pipeline; MeanInsert, mean insert size, defined as the length of the sequence between the adapters; GenomeFraction, total number of aligned bases in the reference, divided by the genome size (a base in the reference genome is counted as aligned if at least one contig has an alignment to the base; contigs from repeat regions may map to multiple places and, thus, may be counted multiple times); NG50, contig length such that using equal or longer length contigs produces x% of the length of the reference genome, allowing for comparisons between different genomes (larger NG50 values generally correlate with a higher quality assembly); Contigs, total number of contigs in the assembly (fewer contigs generally correlate with a higher quality assembly). Abbreviations for run metrics: ClusterDensity, density of clusters (K mm−2); PercClustersPF, percentage of clusters which passed filtering; Reads_M, number of reads (clusters) in millions; ReadsPF_M, number of reads (clusters) that passed filtering (millions); Yield, number of gigabases that passed filtering; Q30, percentage of bases with a Q score ≥30.

