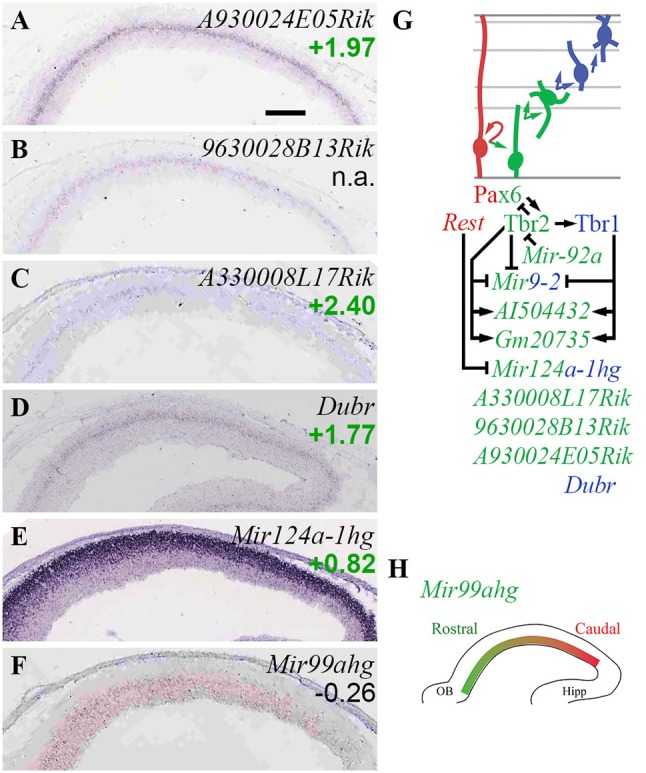
Figure 12.

Non-coding RNA. (A–F) Expression of indicated genes. Remarkably, several lncRNA genes (A–D) showed similar expression patterns in bIPs and/or new neurons in SVZ/IZ. ISH: Genepaint. Scale bar: 100 μm. (G) Summary of ncRNA gene expression and regulation. (H) Expression of Mir99ahg (high rostral) was not regulated by Pax6, Tbr2, or Tbr1; but may shape the high caudal gradient of its target, Fgfr3 (not shown). See text for details.
