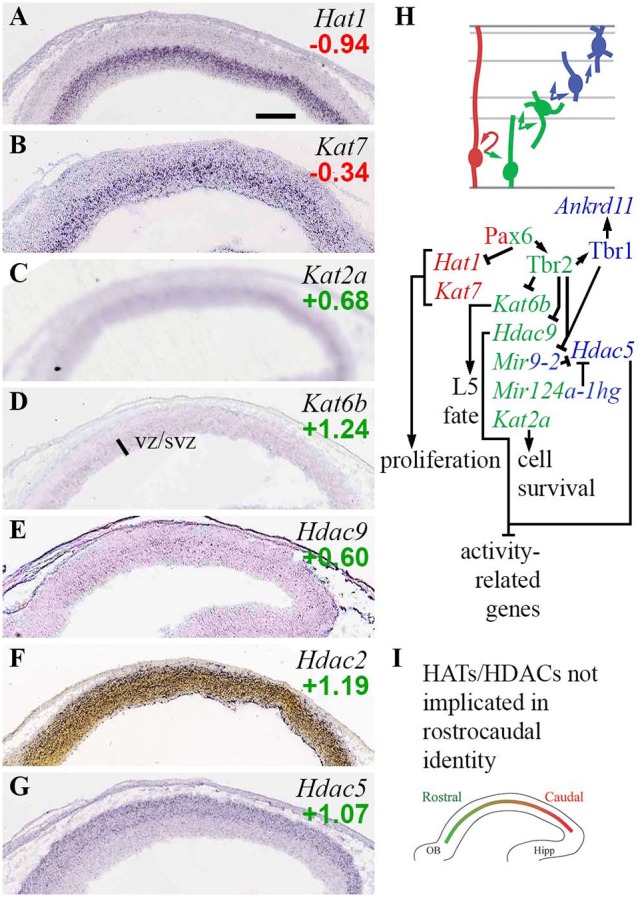
Figure 3.

Histone acetylases (HATs) and deacetylases (HDACs). (A–G) Expression of indicated genes. Hat1 (A) and Kat7 (B) were RGP-specific. Interestingly, Hdac9 (E) and Hdac5 (G) showed complementary zonal expression in VZ/SVZ and IZ/CP, respectively. ISH: Genepaint (A–E,G) and Allen Institute (F). Scale bar: 100 μm. (H) Cell-type-specific gene expression and regulation. Tbr2, Tbr1, and Mir9-2 regulate a switch from Hdac9 in progenitors, to Hdac5 in PNs. (I) No HATs or HDACs exhibited regional expression gradients.
