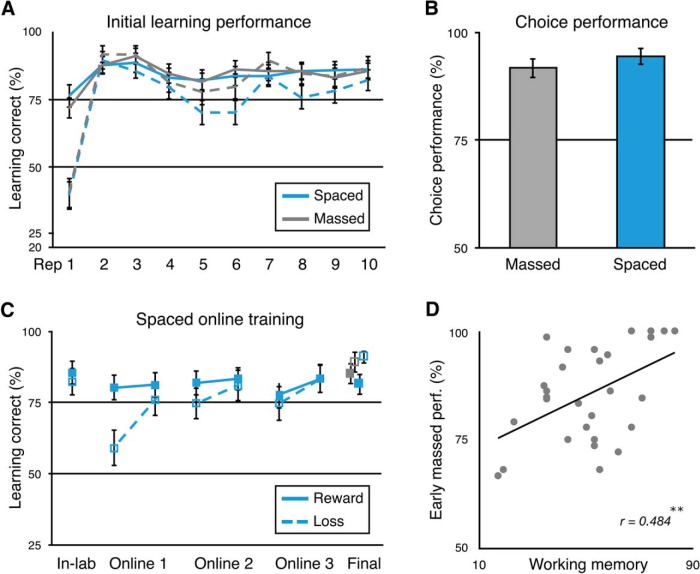
Figure 4.
Study 2 learning results. A, Performance in the initial spaced and massed learning sessions across the first 10 repetitions of each stimulus. Massed stimuli are shown in gray; spaced in blue; reward-associated stimuli in solid lines; loss-associated stimuli in dotted lines. B, Incentivized two-alternative forced-choice performance between reward- and loss-associated stimuli following the completion of all learning repetitions. C, Spaced performance across training and terminal performance for spaced and massed stimuli. Performance is shown for the last in-lab repetition and the first and last (fifth) repetition of each stimulus per online session. Terminal performance is represented as the average of the final two repetitions of each stimulus in the last learning session. D, Positive correlation between early massed-trained stimulus learning performance and working memory capacity (OSPAN). **p < 0.01. Error bars indicate SEM.

