Figure 5.
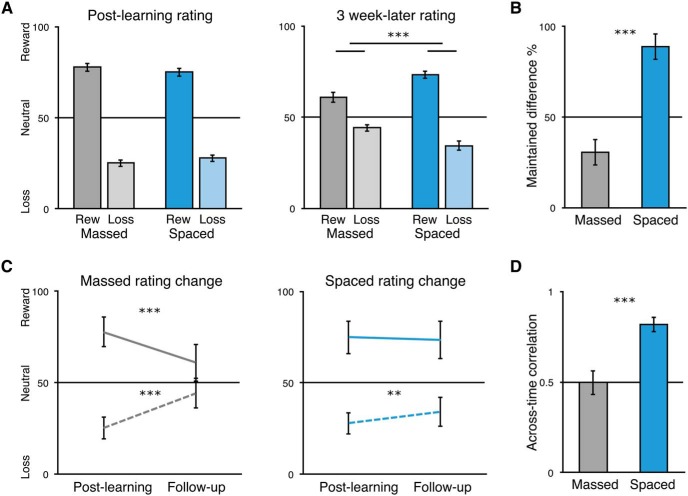
Study 2 post-learning reward association strength and maintenance of value associations. A, Reward association ratings for the massed- and spaced-trained stimuli after the second in-lab session (left) and after the 3-week-later in-lab final reward association rating session (right). Reward-associated stimuli are shown in darker colors; loss-associated stimuli in lighter colors. B, Percentage of initial reward association difference (reward minus loss associated rating) after the second in-lab session maintained across the 3-week delay to the third in-lab session shown separately for massed- and spaced-trained stimuli. C, Post-learning and 3-week follow-up ratings replotted within condition for reward-associated (solid line) and loss-associated stimuli (dotted line). D, Average of the correlation (r) within-participant of massed-trained stimulus reward ratings and spaced-trained stimulus reward ratings (statistics were computed on z-transformed ratings). **p < 0.01, ***p < 0.001. Error bars indicate SEM (A, B, D) or within-participants SEM (C).

