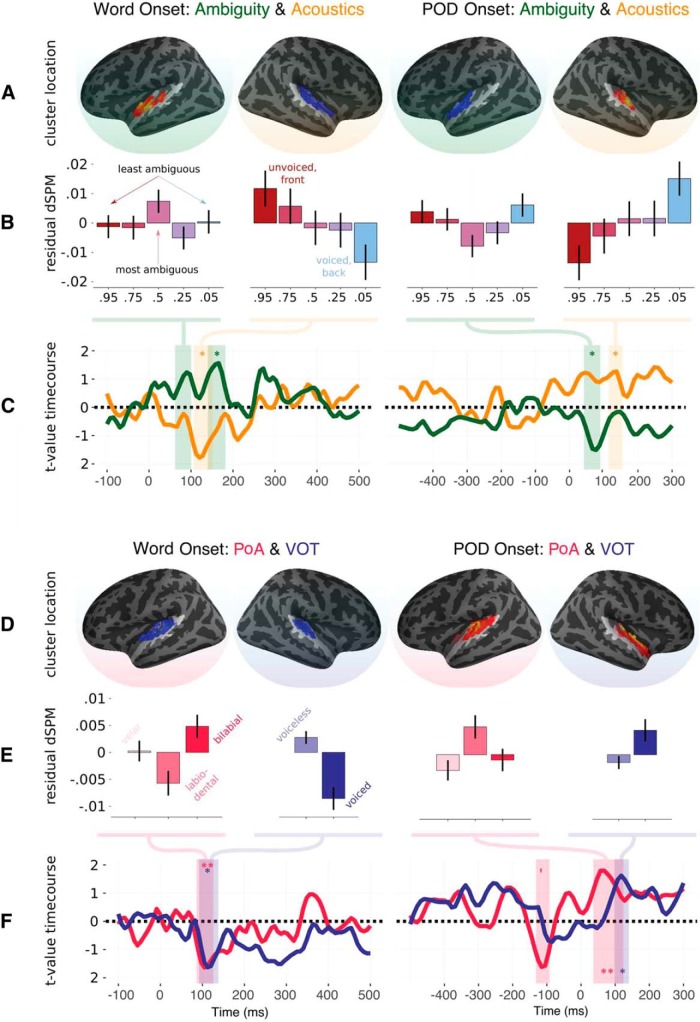
Figure 5.
Time course of regression analysis for the four primary variables of interest for Experiment 2 time-locked to word onset (left column) and point of disambiguation (right column). A, Location of the most significant cluster for ambiguity (green) and acoustics (orange) derived from the spatiotemporal cluster test. B, Activity for each step on the continuum, averaged over the spatio-temporal extent of the cluster, after regressing out the other variables in the model: Plotting ambiguity effect after regressing out acoustics and feature type; plotting acoustic effect after regressing out ambiguity and feature type. C, Mean t-values averaged in the corresponding cluster for ambiguity and acoustics when put into the same regression model. Note that because the cluster is formed based on the sum of adjacent t-values that may be either above 1.96 or below −1.96, the mean value over sources is not directly interpretable as “t above 1.96 = p < 0.05.” D, Location of the most significant cluster for PoA (pink) and VOT (blue). E, Activity averaged for each level of the phonetic features when regressing out the other phonetic feature; for example, regressing out the effect of VOT and then plotting residual activity along the PoA dimension and vice versa. F, Mean t-values averaged in the corresponding cluster for PoA and VOT when put into the same regression model. *p < .05, **p < .01.

