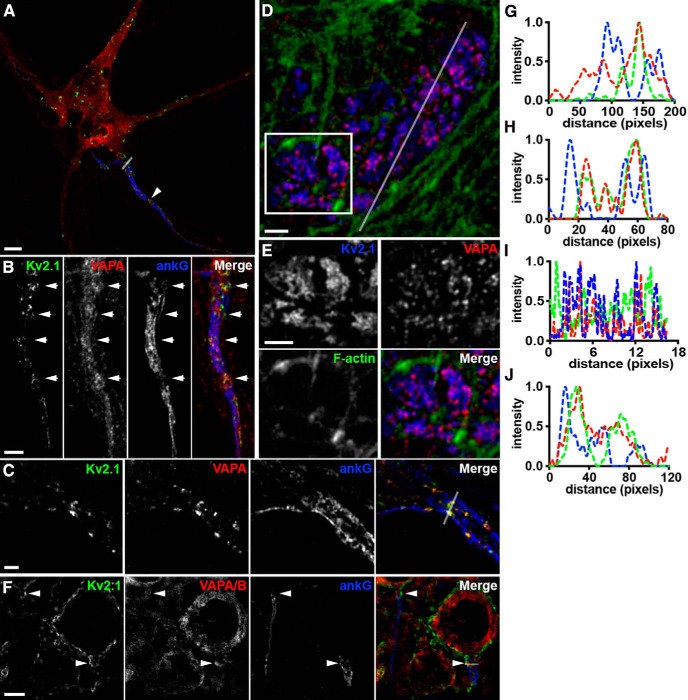
Figure 10.
Endogenous complexes of Kv2.1 and VAPs represent specialized domains within the cortical actin cytoskeleton. A, Representative image of a single fixed CHN immunolabeled for Kv2.1 (green), VAPA (red), and ankG (blue) and imaged with superresolution (Airyscan; Zeiss) microscopy. Arrowhead denotes region of AIS enlarged in B. Scale bar, 5 μm. B, Magnified view of axon initial segment indicated in A. Arrows point to sites of colocalized Kv2.1/VAPA in “voids” in ankG. Scale bar, 3 μm. C, AIS of a distinct fixed CHN immunolabeled for Kv2.1 (green), VAPA (red), and ankG (blue) and imaged with superresolution (N-SIM; Nikon) microscopy. Scale bar, 1.5 μm. D, Representative image of a single fixed HEK293T cell expressing GFP-Kv2.1 (blue) immunolabeled for endogenous VAPA (red) and phalloidin stained for filamentous actin (green). Scale bar, 1.25 μm. E, Magnified view of selection indicated in D. Scale bar, 1.25 μm. F, Representative images of cortical neurons (layer 5) from intact mouse brain sections immunolabeled for Kv2.1 (green), VAPA/B (red), and ankG (blue). Arrows point to sites of associated Kv2.1 and VAPA/B puncta in “voids” in ankG. Scale bar, 5 μm. G, Line scan analysis of intensity of selection indicated in A. H, Line scan analysis of intensity of selection indicated in merged image of C. I, Line scan analysis of intensity of selection indicated in D. J, Line scan analysis of intensity of merged image of F.

