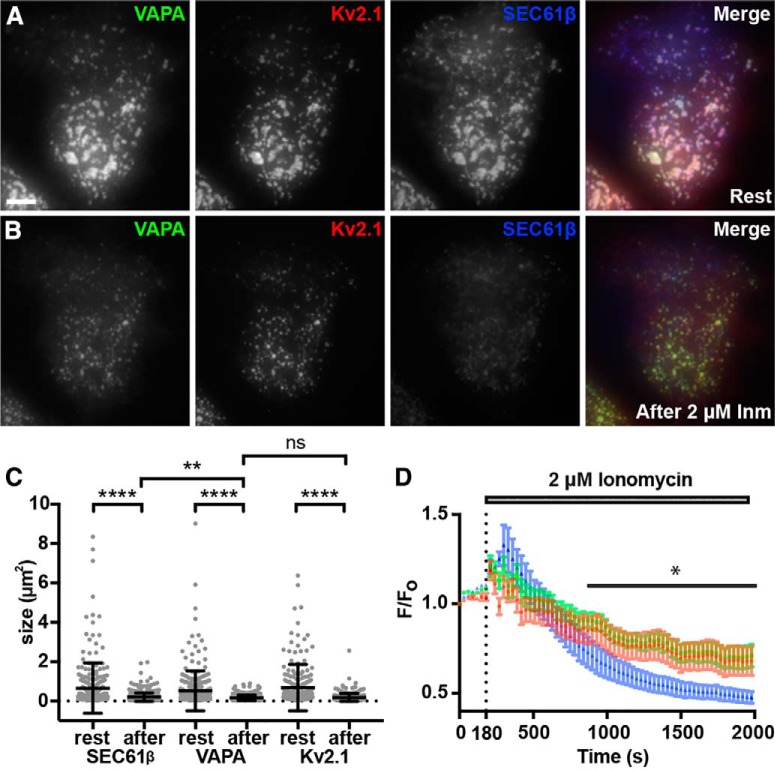
Figure 4.
Dispersal of Kv2.1 from ER-PM junctions via elevation of intracellular Ca2+ results in a coordinated reduction in ER-PM junction and VAPA puncta size. A, Representative images of a single live HEK293T cell coexpressing GFP-VAPA (green), DsRed-Kv2.1 (red), and BFP-SEC61β (blue), imaged with TIRF, before 2 μm Inm treatment (Rest). Scale bar is 5 μm and holds for all panels. B, Same cell as in A after 30 min incubation in 2 μm Inm. C, Summary graph of the impact of Inm treatment on the sizes of ER-PM junctions (****p = 4 × 10⁻¹⁵), VAPA puncta size (****p = 5.254 × 10⁻¹²), and Kv2.1 cluster size (****p = 2 × 10⁻¹⁴). All comparisons were with two-tailed unpaired t tests of values before versus after Inm treatment from n = 3 cells each. The changes in the sizes of ER-PM junctions and VAP clusters are significantly different (**p = 0.0044). D, Normalized peak fluorescence intensity measurements of GFP-VAPA (green), DsRed-Kv2.1 (red), and BFP-SEC61β (blue) over the course of Inm treatment. Note the significant difference between VAPA and SEC61β intensity following Inm treatment for all time points following 900 s (0.005969 ≤ *p ≤ 0.0333, n = 3 cells, two-tailed paired t test).

