Figure 6.
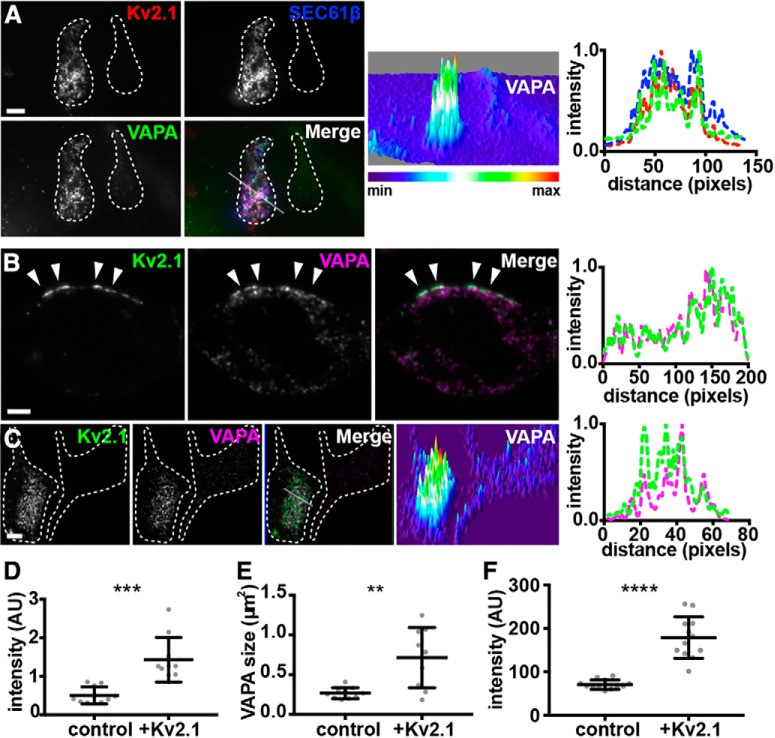
Kv2.1 colocalizes with and recruits endogenous VAPs to Kv2.1-mediated ER-PM junctions in HEK293T cells. A, TIRF image of a pair of fixed HEK293T cells, the left of which is coexpressing DsRed-Kv2.1 (red) and BFP-SEC61β (blue), fixed, and immunolabeled for endogenous VAPA (green). Scale bar, 5 μm. Surface plot of VAPA intensity shown in right panel. Note the difference in VAPA intensity in left versus right cell. Line scan analysis of selection indicated in merged image of F is shown to the far right. B, Single optical section (Apotome; Zeiss) taken through the center of a fixed HEK293T cell expressing GFP-Kv2.1 (green) and immunolabeled for endogenous VAPA (magenta). Note the presence of PM Kv2.1 clusters overlaying projections of VAPA toward the cell cortex. Scale bar, 5 μm. Line scan analysis of selection indicated by arrows in merged image of B is shown to the far right. C, Single optical section (Apotome) of a pair of fixed HEK293T cells, the left of which is expressing GFP-Kv2.1 (green) and immunolabeled for endogenous VAPA (magenta). Note the difference in VAPA intensity in left versus right cell. Scale bar, 5 μm. Surface plot of VAPA intensity shown in right panel. Line scan analysis of the merged image in C is shown to the far right. D, Summary graph of VAPA intensity (TIRF) measurements from Kv2.1-expressing versus nontransfected cells (**p = 0.001659, n = 10 cells, two-tailed unpaired t test). E, Summary graph of VAPA puncta size (TIRF) measurements from Kv2.1-expressing versus nontransfected cells (**p = 0.001894, n = 10 cells, two-tailed unpaired t test). F, Summary graph of VAPA intensity (Apotome) measurements from the basal PM of Kv2.1-expressing versus nontransfected cells (**p = 0.001659, n = 10 cells, two-tailed unpaired t test). ***p = 0.000166, ****p = 1.312 × 10⁻⁸.

