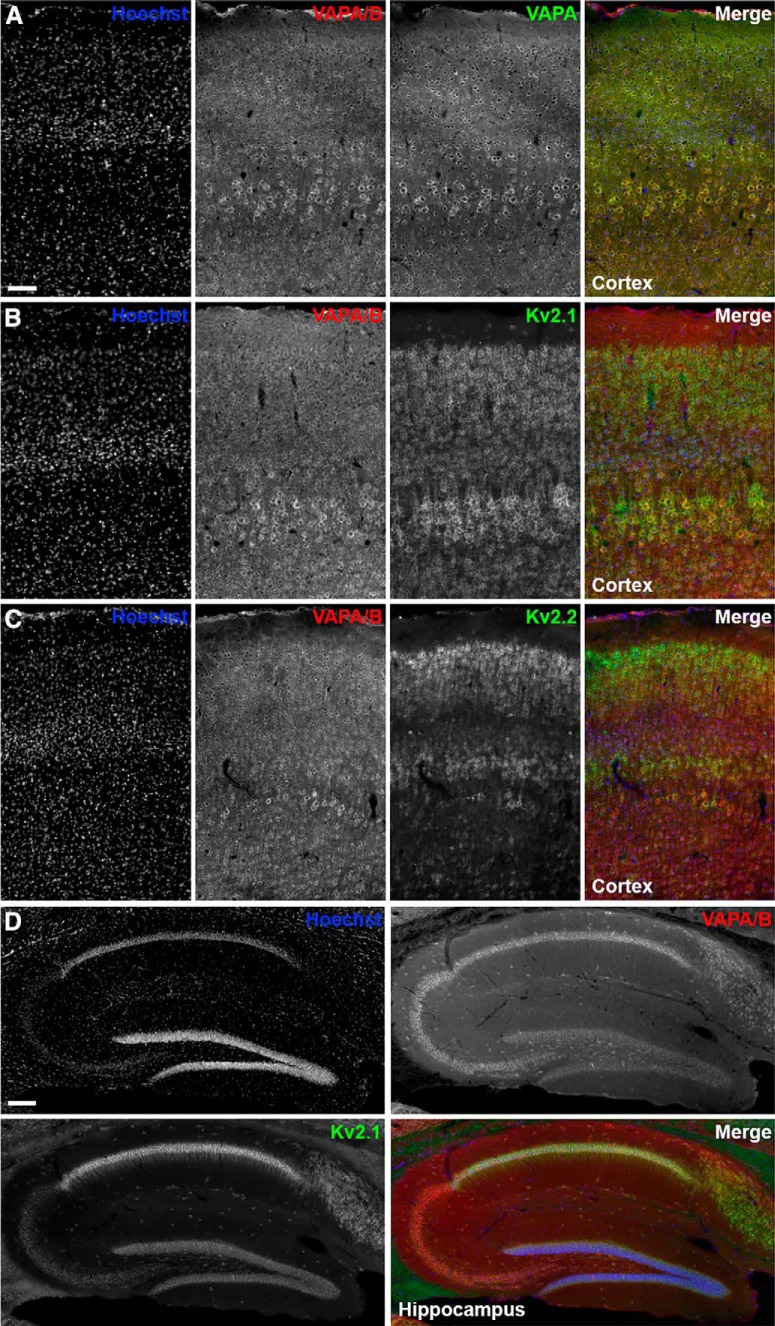
Figure 7.
Cellular expression of Kv2 channels and VAPs in mouse brain. A, Representative images of mouse cortex stained with Hoechst (blue) and immunolabeled for VAPA/B (red) and VAPA (green). Scale bar, 75 μm. B, Representative images of mouse cortex stained with Hoechst (blue) and immunolabeled for VAPA/B (red) and Kv2.1 (green). C, Representative images of mouse cortex stained with Hoechst (blue) and immunolabeled for VAPA/B (red) and Kv2.2 (green). D, Representative images of mouse hippocampus stained with Hoechst (blue) and immunolabeled for VAPA/B (red) and Kv2.1 (green). Scale bar, 150 μm.

