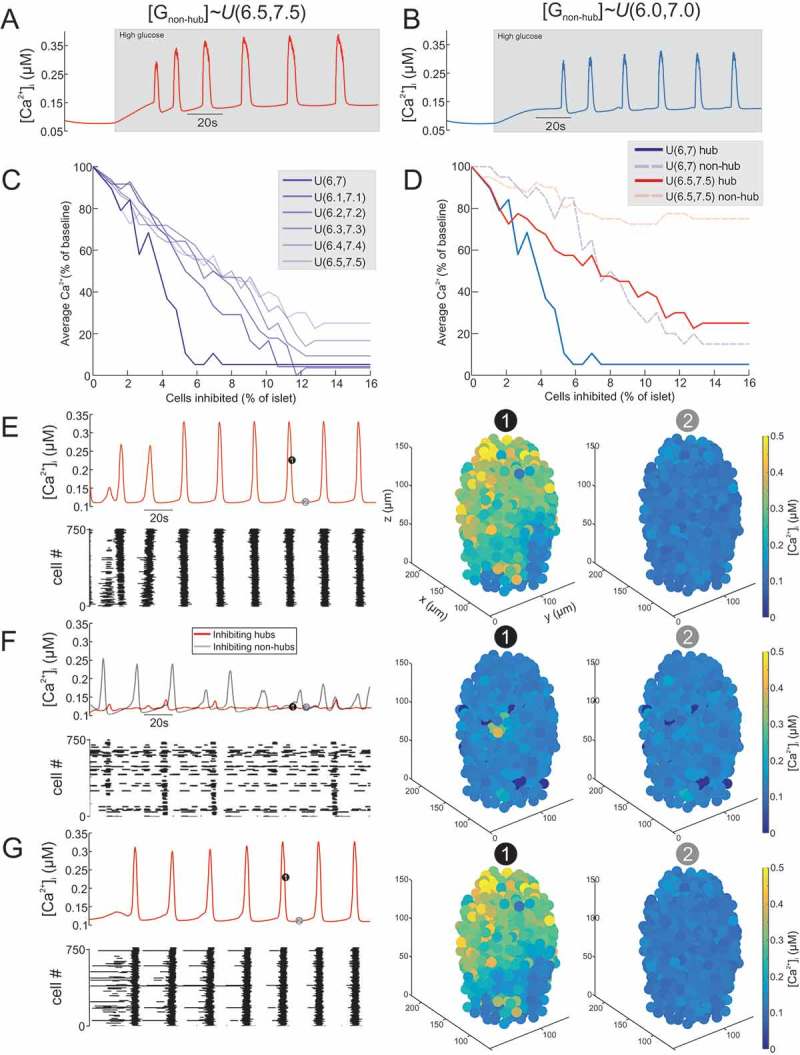
Figure 1.

Inhibition of hub cells can abolish whole-islet Ca2+ activity. (A) activity of mouse islet model when the GJ conductance for non-hubs is sampled from a uniform distribution over the interval 6.5-7.5mM ). The model produces robust oscillations in response to high glucose. (B) activity of mouse islet model when the GJ conductance for non-hubs is sampled from a uniform distribution over the interval 6.0-7.0mM The model produces robust oscillations in response to high glucose. Simulated islet (C) activity during inhibition of hub cells. The number of hub cells inhibited is represented as the % of all cells in the islet (750 cells). The different simulations are for sampling from different uniform distributions. Note how hub inhibition has the strongest effect when . Simulated islet (D) activity during inhibition of hub or non-hub cells. When mM, hub inhibition strongly suppresses whole-islet . In contrast, when mM, hub inhibition has little effect on whole-islet . Mean (E) for all β-cells in a mouse islet model, during high glucose condition. Raster plot showing activity in each β-cell. 3D plot of for each β-cell in the islet model at time points (1) and (2). Mean (F) for all β-cells in a mouse islet model, during hub inhibition and non-hub inhibition. 45 hub cells or non-hub cells where inhibited simultaneously. Raster plot showing activity in each β-cell during the hub inhibition condition. 3D plot of for each β-cell in the islet model at time points (1) and (2) during hub inhibition. Mean (G) for all β-cells in a mouse islet model, during recovery from hub inhibition. Raster plot showing activity in each β-cell. 3D plot of for each β-cell in the islet model at time points (1) and (2). cf. S1 Video.
