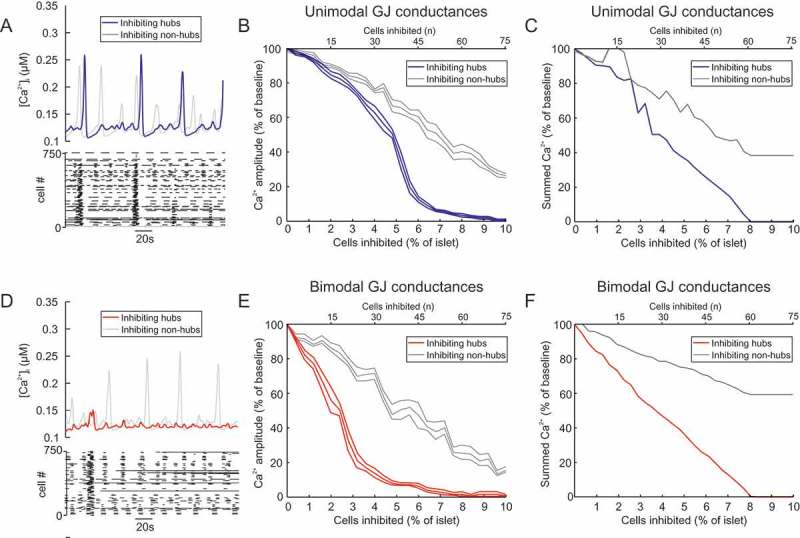
Figure 3.

Bimodal gap junction strength influences the importance of hubs. (A) Mean for all β-cells in a mouse islet model with unimodal GJ conductances (mean 20 pS), during hub inhibition and non-hub inhibition. Raster plot showing activity in each β-cell during the hub inhibition condition. (B) activity in a mouse islet model as a function of the number of cells inhibited (% of islet). The GJ conductances in this model are unimodal, with GJ conductances for hubs and non-hubs sampled from a distribution with mean 20 pS. Either hubs or non-hubs were inhibited and the resultant activity amplitude (% of no inhibition amplitude) was quantified. Error bars show the SEM for re-running of both of these simulations for 6 different random seeds. The hub inhibition simulations have an IC50 of 2.59±0.4% (mean ± SEM). (C) activity in a mouse islet model as a function of the number of cells inhibited (% of islet). The GJ conductances in this model are unimodal, with GJ conductances for hubs and non-hubs sampled from a distribution with mean 20 pS. Either hubs or non-hubs were inhibited and the summed activity (% of no inhibition) was quantified. (D) Same as in (A) but for all β-cells in a mouse islet model with bimodal GJ conductances, during hub inhibition and non-hub inhibition. Raster plot showing activity in each β-cell during the hub inhibition condition. (E) Same as in (B) but for bimodal GJ conductances, with GJ conductances for hubs sampled from a distribution with larger mean (50 pS) than non-hubs (10 pS). Either hubs or non-hubs were inhibited and the resultant activity amplitude (% of no inhibition amplitude) was quantified. Error bars show the SEM for re-running of both of these simulations for 6 different random seeds. The hub inhibition simulations have an IC50 of 2.59±0.4% (mean ± SEM). (F) Same as in (B) but for bimodal GJ conductances, with GJ conductances for hubs sampled from a distribution with larger mean (50 pS) than non-hubs (10 pS). Either hubs or non-hubs were inhibited and the summed activity (% of no inhibition) was quantified. Note how silencing non-hubs has a minimal effect on summed output. cf. S2 Video.
