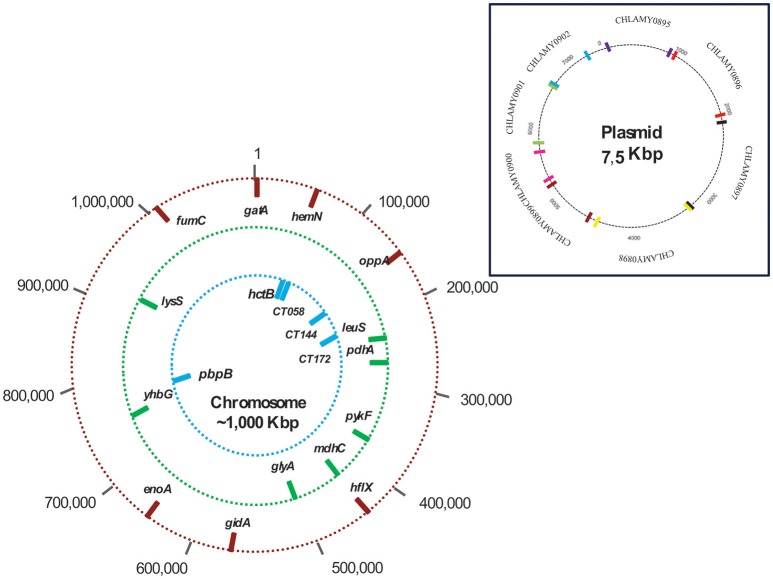
Figure 1.
Chromosome and plasmid mapping of studied loci. The outer circle (red bars) shows the location of the 7 markers used in the scheme A (Chlamydiales-Ct); the middle circle (green bars) shows the location of the 7 markers in scheme B (C. trachomatis); and the inner circle (blue bars) shows the location of the 5 markers in scheme C (C. trachomatis Uppsala). Scheme D molecular markers are plasmid loci.

