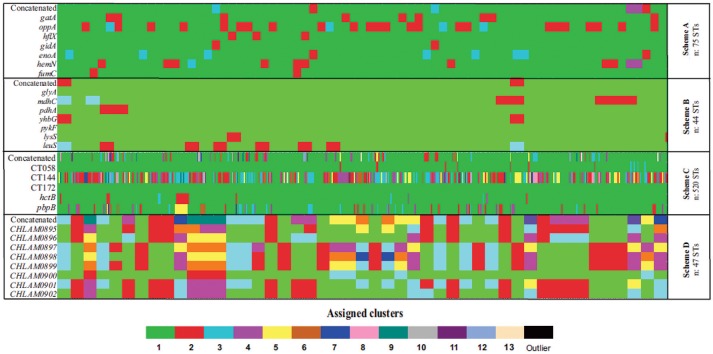
Figure 5.
Allele plot. Graphical representation of phylogenetic inferences regarding the markers for the MLST schemes evaluated; each cluster is represented by a color (≥80.0% bootstrap) found per gene (row). The cluster to which each ST (columns) belongs was analyzed. (A) Scheme A (Chlamydiales-Ct). (B) Scheme B (C. trachomatis), (C) scheme C (C. trachomatis Uppsala), (D) scheme D (plasmid loci).

