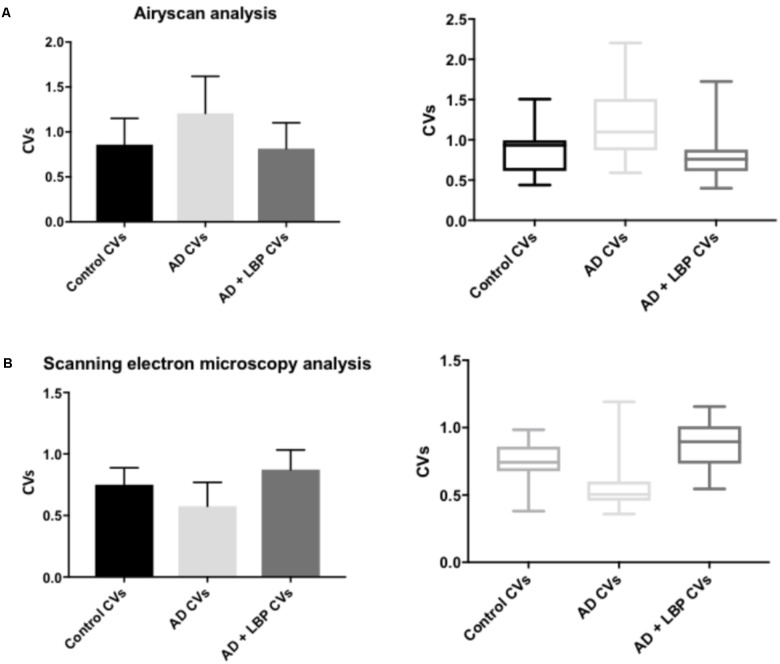
FIGURE 6.
Graphs and boxplots from coefficient of variation (CVs) form histogram data of Airyscan analysis (A) and SEM (B). Coefficients of variation (CV) of the intensity of the pixels in the clot images was done using the Tukey’s analysis. Control vs. AD and AD vs. AD + LBP significantly differ by < 0.0001. Control vs. AD + LBP are not significantly different.

