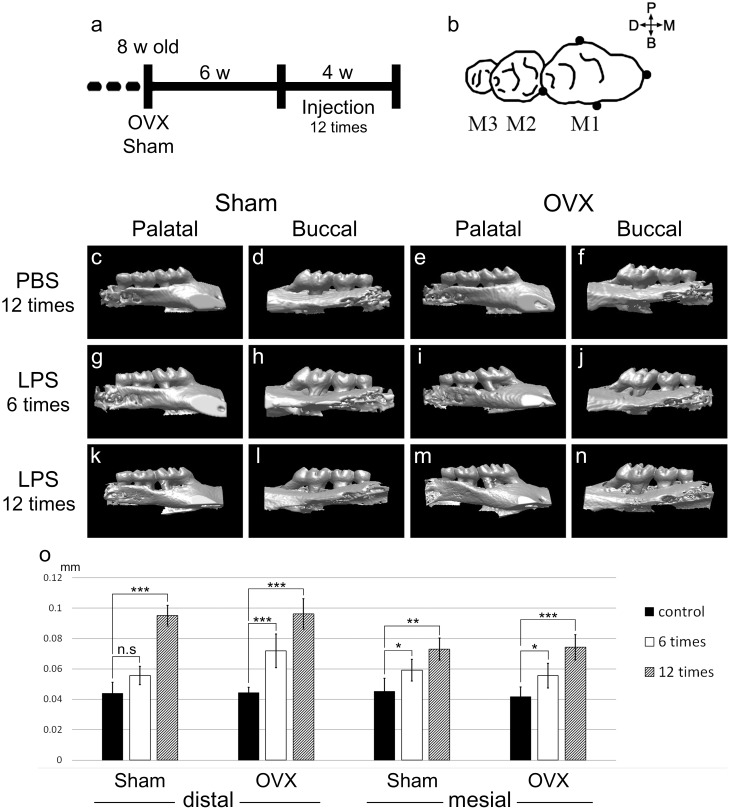
FIGURE 1.
LPS application and alveolar bone crest level reduction. (a) Schematic diagram depicting timing of the experimental design. OVX or Sham was operated in 8-week-old mice. Six weeks after the operation, PBS and LPS were injected 12 times for 4 weeks. (b) The four injection points (black dots) around maxillary M1. 5.0 μg of LPS in 2.5 μl of PBS or 2.5 μl of PBS was injected per point in an injection time. (c–n) Micro-CT 3D reconstructed images captured from the palatal or buccal side. (c–f) CT images were scanned at 3 days after the 12th injection of PBS for the control groups. (g–j) At 6th injection period. (k–n) At 3 days after 12th injection period. 3D images of the LPS groups (g–n) were flipped left and right for directional unification. (o) CEJ-ABC distances were measured in the mesial and distal side of M1 from CT scan images. The results are expressed as the mean ± SD (n = 15, three CT images per group of five mice). ∗p < 0.05, ∗∗p < 0.01, ∗∗∗p < 0.005.

