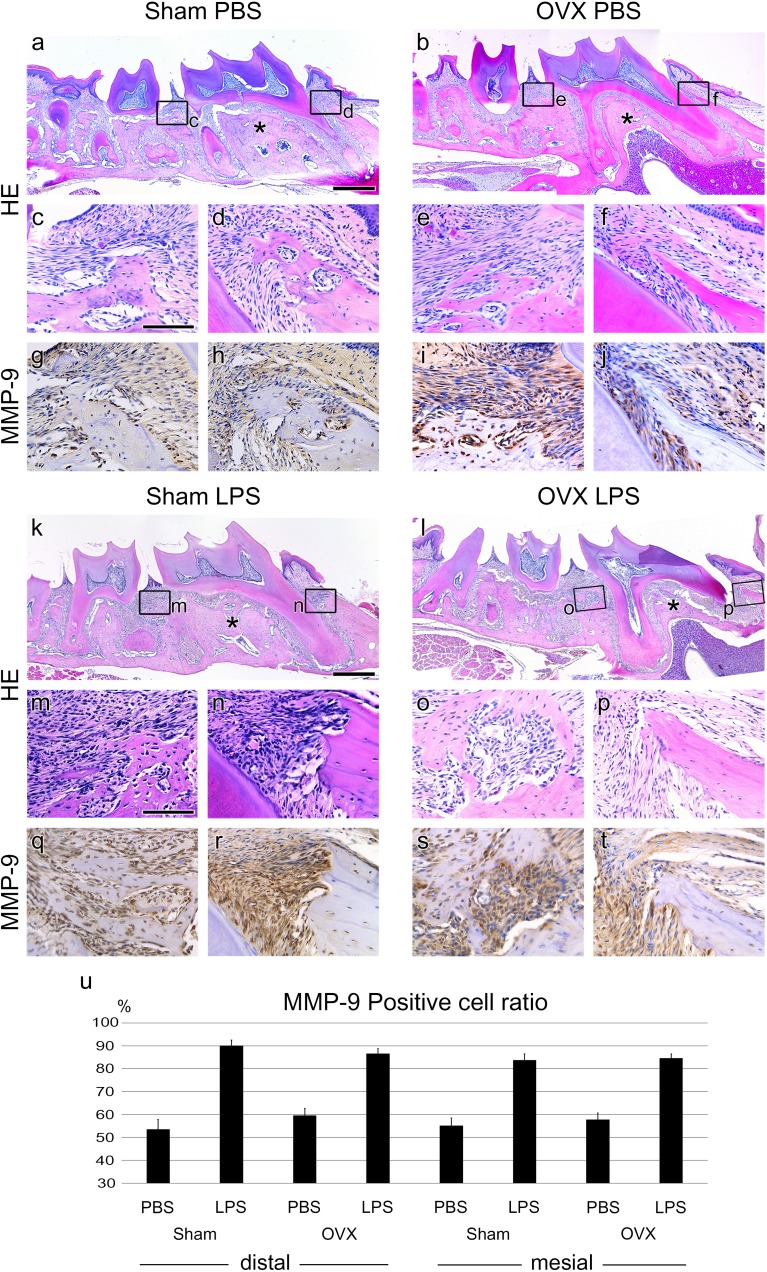
FIGURE 2.
Periodontitis progression of Sham and OVX mice. (a,b,k,l) Sagittally sectioned HE-stained image of PBS or LPS injected in Sham and OVX mice. Asterisks (∗) indicate inter-radicular area of M1. (c–f, m–p) High magnification of panel a,b,k,l. (d,f,n,p) Mesial side of M1. Alveolar bone thicknesses are different between Sham and OVX groups. (g–j, q–t). IHC of the periodontitis progression marker, MMP-9. The MMP-9-positive cells were around the PDL tissue of the injected position. (n) The ratio of MMP-9-positive cells to total cells. The results are expressed as the mean ± SD (N > 25, three 0.04 mm2 squares were randomly chosen from the two section images for each mouse). MMP-9-positive cells between PBS and LPS treated samples of all groups were significant (p < 0.005). Scale bars, a,b,k,l, 500 μm; c–j, m–t, 100 μm.

