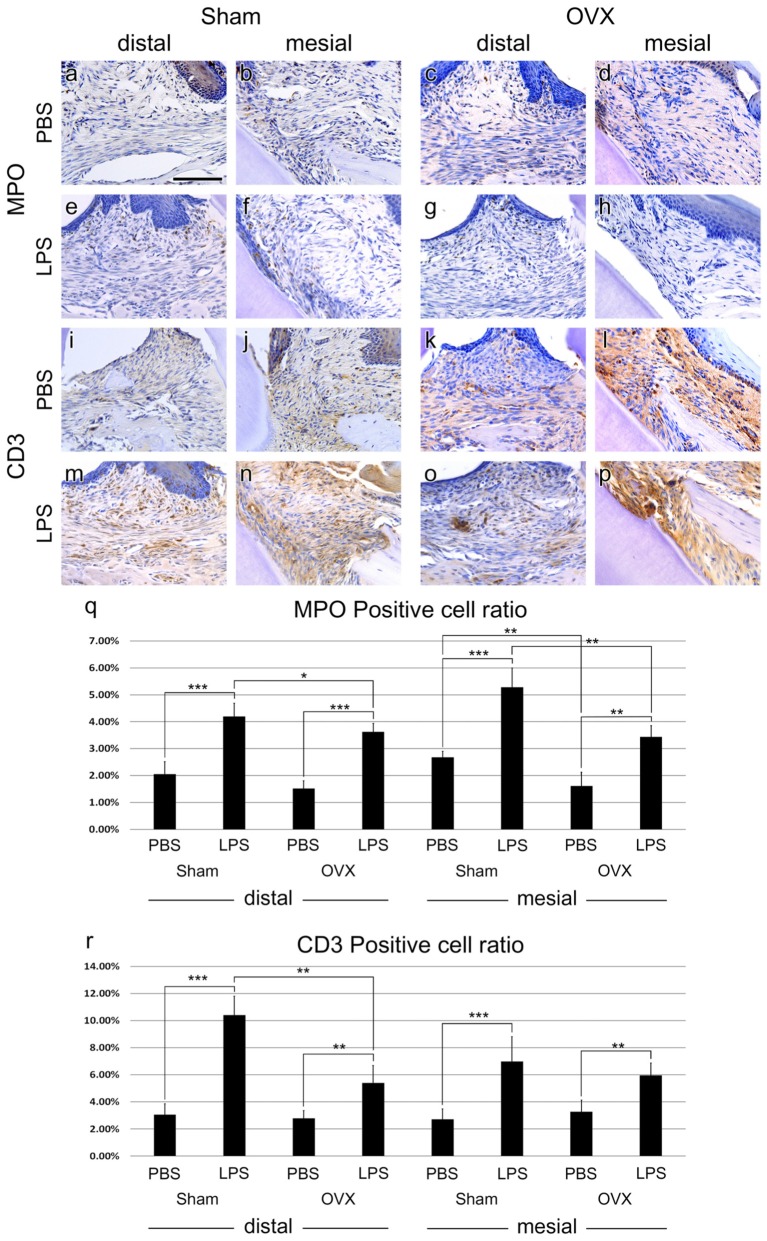
FIGURE 3.
Immune cell migration. (a–h) IHC of neutrophil marker, MPO. MPO-positive cells were found just below the epithelium of the injection area. (i–p), IHC of T cell marker, CD3. CD3-positive cells were shown all around the injection area. (q,r) MPO- and CD3-positive cells ratio analysis at the injection area. The results are expressed as the mean ± SD. ∗p < 0.05, ∗∗p < 0.01, ∗∗∗p < 0.005. Scale bar, 100 m.

