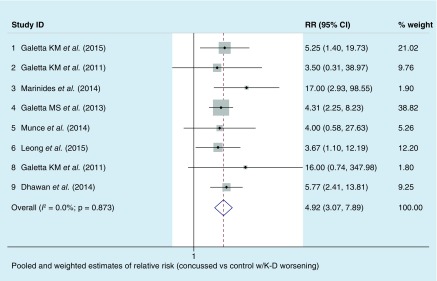
Figure 5. . Distribution of relative risk of concussed versus control athlete status in the setting of any worsening of time score from preseason baseline for the King-Devick test.
Dots represent point estimates of each study's relative risk; size of the gray box reflects the weight of the study in meta-analysis. Bars are 95% CI. The diamond shows the weighted estimate for the relative risk; this is determined from fixed-effects models account for study N and precision (narrowness of 95% CI). I2 statistic values were 0.0%; p = 0.87, indicating very little heterogeneity between studies in calculation of the weighted estimate. Stated differently, the nonsignificance of the I2 test for heterogeneity suggests that the differences between the studies are explicable by random variation. Study ID numbers are not consecutive since some studies did not have postinjury data.
RR: Relative risk; K-D: King-Devick.

