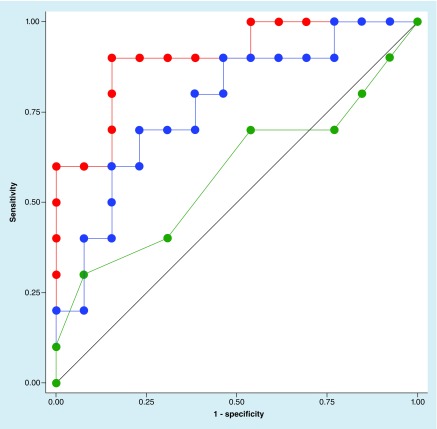
Figure 7. . Comparisons of receiver operating characteristic curve areas for the three sideline tests for distinguishing concussed versus nonconcussed control athletes on the sideline among athletes who underwent all measures (n = 23).
King-Devick = red line versus timed tandem gait = blue line versus Standardized Assessment of Concussion = green line. Receiver operating characteristic curve areas represent the probability that a test or combination can correctly distinguish between two categories (concussed vs nonconcussed control).

