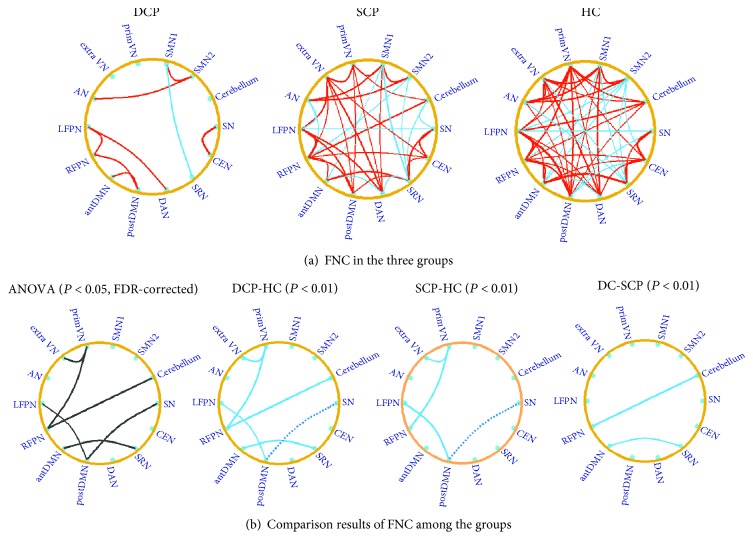
Figure 3.
(a) The functional network connectivity in the DCP, SCP, and HC group. The red line represents the connection with positive correlation, and the blue line represents the connection with negative correlation. The results were obtained by the one-sample t-test with a threshold of corrected P < 0.05. (b) The comparison results of the functional network connectivity between the groups. The black line in the ANOVA result represents the altered connection among the three groups. Differences of functional network connectivity between DCP and HC and between SCP and HC, as well as between DCP and SCP, were observed. The blue solid line represents the connection with decreased positive FNC in CP children; and the blue dotted line represents the connection with decreased negative FNC in CP children.

