Figure 2.

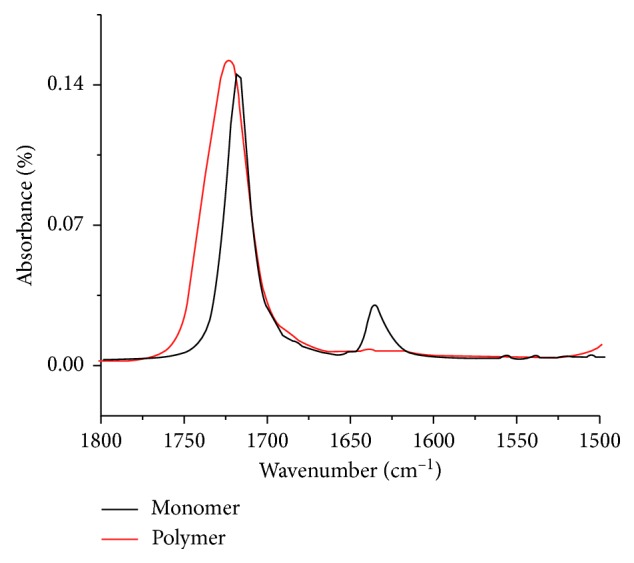
FTIR-ATR spectrum of MMA and PMMA in the region of 1800–1500 cm−1. The band at 1635 cm−1, referring to the C=C bond, appears in the MMA spectrum and does not appear in the PMMA spectrum, evidencing the conversion.

FTIR-ATR spectrum of MMA and PMMA in the region of 1800–1500 cm−1. The band at 1635 cm−1, referring to the C=C bond, appears in the MMA spectrum and does not appear in the PMMA spectrum, evidencing the conversion.