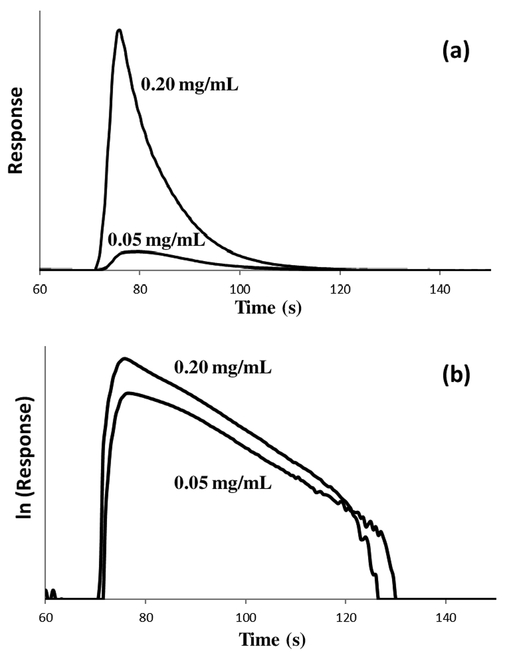
Figure 3.
(a) Elution profiles and (b) natural logarithm of the elution profiles obtained following the application of 20 μL of 0.05 or 0.20 mg/mL labeled goat IgG onto a 5 mm × 2.1 mm I.D. protein G microcolumn. These elution profiles were obtained using a pH 2.5 elution buffer that was passed through the microcolumn at 0.50 mL/min.

