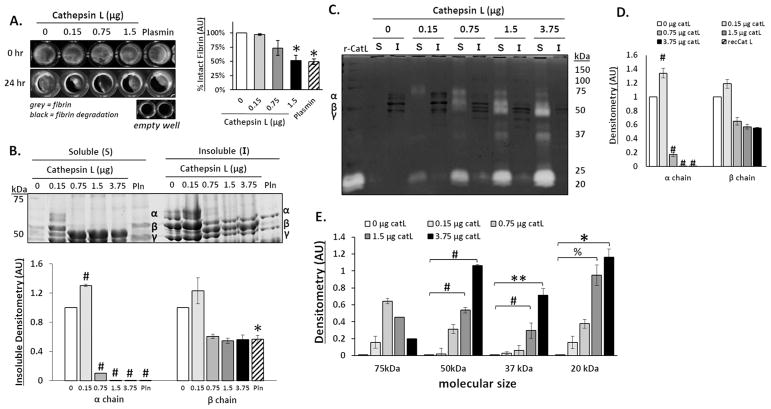
Figure 1. Cathepsin L degrades fibrin gels, releasing fibrin degradation products into the supernatant.
Fibrin gels (100 μl) were polymerized in 96 well plates then incubated with increasing amounts of cathepsin L (catL) in 50 μl assay buffer for 24hrs. (A) Fibrin gels were imaged in 96 well plates before (0 h) and after (24 h) incubation, where grey color indicates intact fibrin and black indicates areas of degraded fibrin gel, as shown by the black levels in the empty wells. Area of grey intensity were quantified to determine intact fibrin percentage. The fibrin gel was degraded by 3%, 26%, and 48% for 0.15, 0.75, and 1.5 μg, respectively, with a significant decrease at 1.5μg of catL compared to the no enzyme control. (B) After degradation, the fibrin fragments released into the supernatant (denoted to as the soluble fraction) were collected and the remaining fibrin gel (insoluble fraction), was collected and solubilized with β-mercaptoethanol to prepare it for SDS-PAGE. Coomassie stained protein bands of α (63.5 kDa), β (56 kDa), and γ (47 kDa) chains of fibrin are visible in the insoluble fraction. Densitometry of bands are quantified in the graph below. As the amount of catL increased, there was a significant loss of the α chain from the insoluble gel fraction. (C) Cathepsin zymography was used to assess the amount of active catL. Active catL bands were identified in the soluble fraction at multiple molecular sizes. Unbound active catL appears at 20 kDa and the higher molecular weight (75 to 37kDa) bands of active catL appear in a cascading pattern that corresponds to the degraded α and β fibrin fragments. D) Densitometry of insoluble α and β chains of fibrin bands visible in the zymogram (darker bands) are quantified in the graph. E) Active catL bands (cleared white bands) at 75 kDa, 50 kDa, 37 kDa, and 20 kDa bands are quantified by densitometry in the graph (n=3–5, **p<0.05; %p<0.01; *p<0.005; # p<0.0001).

