
Figure 5.
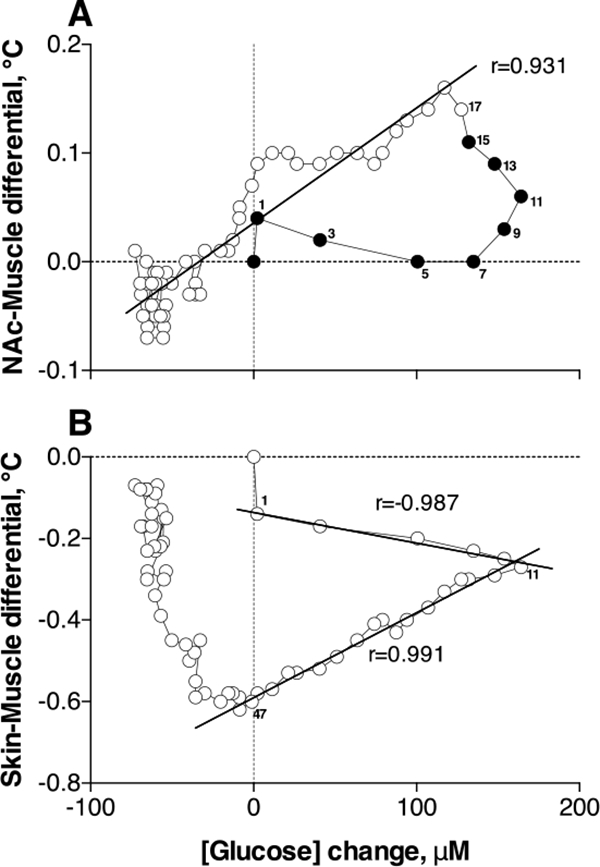
Correlative relationships between heroin-induced changes in NAc glucose and NAc-Muscle (A) and Skin-Muscle (B) temperature differentials. Numbers on both graphs show the time intervals when both parameters were measured. Filled symbols in A show the initial interval, where correlation was absent. For other details see the text.