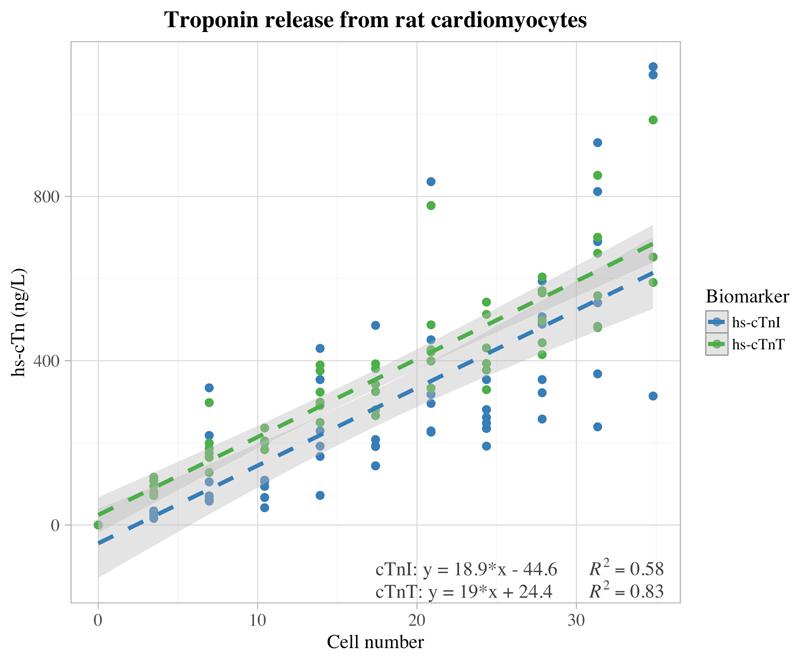
Figure 1.
Graph showing linear regression between number of rat cardiomyocytes and resultant cardiac biomarker concentration as measured by high-sensitivity assays (hs-cTnI and hs-cTnT) in 400 µL of human serum; cTnI (n=61, excluding one outlier; y=18.9 [95% CI 14.7–23.1] *x – 44.6 [95% CI -128.8-39.5]) cTnT (n=62; y=19 [95% CI 16.8–21.2] *x - 24.4 [95% CI -18.9-67.7]), both with spikes into serum from 4 different individuals. Light grey shading depicts the boundaries of the 95% confidence intervals, with dark grey illustrating their overlap

