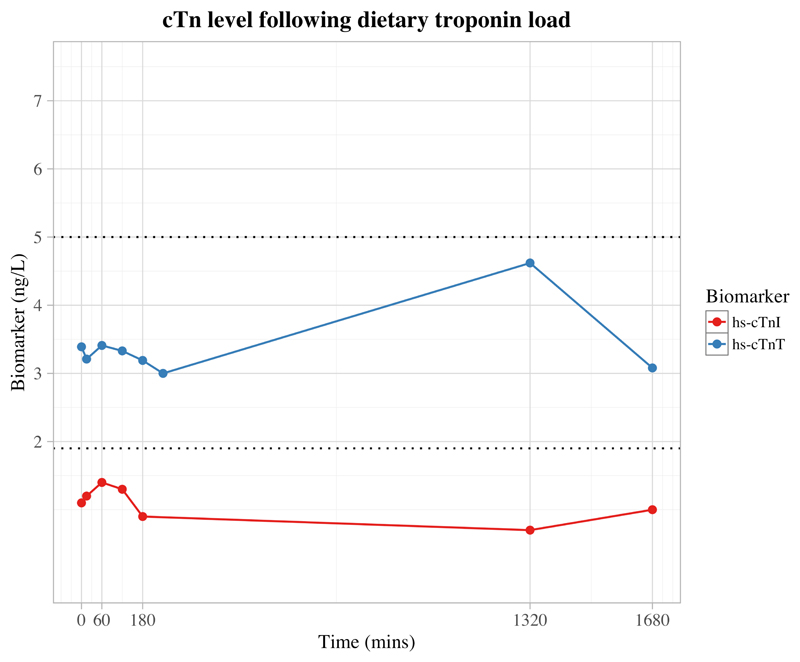
Figure 3.
Graph demonstrating available serum biomarker concentration after an oral load of cooked ovine myocardium at the following time-points: 0 min, 15 min, 1 hr, 2 hrs, 3 hrs, 4 hrs (missing for cTnI), 22 hrs, 28 hrs; all measured values remained below the Limit of Detection (LoD) for high-sensitivity assays (hs-cTnT and hs-cTnI) for the respective biomarkers (cTnT=5 ng/L, cTnI=1.9 ng/L; indicated on plot with dotted lines)

